
Nutrition surveillance in emergency contexts: South Sudan case study
 By Alina Michalska, Eva Leidman, Suzanne Fuhrman, Louise Mwirigi, Oleg Bilukha, and Cecile Basquin
 Alina Michalska is the SMART Programme Manager at Action Contre la Faim (ACF)-Canada. She develops and supports the SMART Methodology, a global metric of assessment of malnutrition, assuring compliance to global standards including accuracy and reliability of data. Alina also conducts trainings worldwide and provides support to regional and national implementation of the methodology.
 Eva Leidman is an Epidemiologist with the Emergency Response and Recovery Branch of the Centers for Disease Control and Prevention. Her experience includes international nutrition and assessment methodologies (including surveys and surveillance) affecting refugees and displaced populations worldwide.
 Suzanne Fuhrman is the Health and Nutrition Head of Department with ACF in Sierra Leone. She was the Coordinator for the ACF Surveillance and Evaluation Team (SET) project in South Sudan. She has five years of experience in the field of nutrition, previously working for Concern Worldwide in Ethiopia, Uganda, and South Sudan, with a strong background in surveys.
 Louse Mwirigi-Masese is currently the Nutrition Information Officer with UNICEF Kenya where she supports the national nutrition information systems in collaboration with the MoH and also provides surge support in the East Africa region, including South Sudan (2014) and Malawi (2015). Prior to this, Louise was a Nutrition Analyst with the FAO/ FSNAU for six years in Somalia.
 Oleg Bilukha is Associate Director of Science with the Emergency Response and Recovery Branch of the Centers for Disease Control and Prevention where Oleg has worked since 2000. He obtained his MD from Lviv State Medical Institute, Ukraine, and his PhD in Nutrition (with minors in Epidemiology and Consumer Economics) from Cornell University, USA. Oleg has served as a consultant and temporary advisor to the WHO, UNHCR, WFP, and UNICEF on multiple assignments worldwide. His extensive experience includes international nutrition, statistics, epidemiology, surveys and surveillance, war-related injury and reproductive health.
 Cécile Basquin is a Nutrition & Health Technical Advisor at ACF-USA headquarters. Cécile joined ACF in early 2010, has managed CMAM, integrated surveillance and community-based prevention of undernutrition programmes in the field, and now provides technical guidance notably to the ACF-South Sudan team.
We thank all of our colleagues involved in collecting the data presented here for their ongoing commitments to collecting rigorous data. In particular we thank the ACF logistics team members for their valuable support and creative thinking, notably with transportation of teams to remote locations during the surveys. We thank the South Sudan Ministry of Health (MoH), particularly Victoria Eluzai, previous Director of Department of Nutrition, and the county officials and county health department teams of Fashoda, Mayendit and Leer counties. For all their support in driving the surveillance agenda in South Sudan, we thank the UNICEF team and members of both the Nutrition Cluster and the Nutrition Information Working Group, particularly co-chair Ismail Kassim (Nutrition Information Manager, UNICEF South Sudan). We thank several key partners who supported ACF teams in the field (World Vision International, MSF, UNIDO, Samaritan's Purse, and The Comboni Missionaries), and the communities of South Sudan for their cooperation. We also thank Victoria Sauveplane (Senior Programme Manager, ACF-Canada) and Maureen Gallagher (Senior Nutrition and Health Technical Advisor, ACF-USA) for reviewing the article. We thank Grainne M. Moloney (Kenya Nutrition Chief, UNICEF) who initiated the nutrition surveillance initiative in South Sudan and provided input and reviewed this article.
This programme was undertaken with the financial assistance of UNICEF. The findings and conclusions in this article are those of the authors and do not necessarily represent the official position of the Centers for Disease Control and Prevention (CDC), Action Against Hunger | Action Contre la Faim (ACF), or the United Nations Children's Fund (UNICEF).
Location: South Sudan
What we know: Reliable nutrition data are critical to assess and respond to a crisis but are often lacking due to resource and population access constraints; monitoring change over time is particularly challenging.
What this article adds: Nutrition surveillance activities were launched in South Sudan mid-2014 due to a deteriorating crisis situation. In ten of the most food insecure counties, ACF launched the Surveillance and Evaluation Team (SET), funded by UNICEF and with technical support from CDC, to monitor the nutrition status, provide the foundations of nutrition monitoring system, and provide technical support to nutrition partners. Rapid SMART was the survey method used. In practice, surveys (eight in total) were limited to three (high priority) of the 10 counties due to lack of implementing partners. High quality anthropometric data was gathered. Challenges included accurate population data, access and logistics, and lack of in-agency survey technical capacity. This experience reflects one feasible option of obtaining periodic, representative prevalence data in a particularly challenging setting.
Why nutrition surveillance in emergencies?
Reliable data are critical to assess the severity of a crisis and respond appropriately. In crises affecting the food security of a population, nutrition indicators inform decisions on types of interventions, geographic prioritisation, and levels of funding.1 Unfortunately, recent experiences have demonstrated that rigorous and representative nutrition data and robust nutrition surveillance systems are often lacking in humanitarian crises with few exceptions, e.g. nutrition surveillance implemented by the Food Security and Nutrition Analysis Unit (FSNAU) in Somalia.23 This is particularly true in the most severe crises when overwhelming needs restrict available resources and limited access constrains the ability to collect data. This challenging paradox—the need for data when they are least available—is common in sudden onset disasters, as well as during severe deterioration of a protracted crisis.
Continuous monitoring of nutrition status over time, often required in a crisis, poses even greater challenges compared to individual assessments. This type of analysis requires ongoing, systematic collection of data, i.e. surveillance.5 Practitioners use many methods of data collection to help monitor changes in the nutritional status of a population and, where possible, respond in a timely manner. There are at least five recognized approaches to nutrition surveillance.6 Nearly all of these methods, however, have key limitations. For instance, health facility-based surveillance systems only include individuals who visit health centres; they are often not representative, potentially over-sampling younger children (who come for immunisations) and those who are sick. Mass screenings include all children, however do not produce ongoing data, and the quality of anthropometry data obtained from mass screenings can be difficult to control. Interpreting data from therapeutic feeding programmes can be challenging, as changes in nutritional status may be attributed to many factors including stock-outs of commodities or changes in access.78 In emergency contexts, using these methods can be even more challenging and costly than in non-emergency settings given access constraints and other factors that may disrupt existing systems.
Currently there is no gold standard for monitoring trends in prevalence of acute malnutrition. However, these data are essential in crisis settings. They are used by responders and more broadly to inform analyses, such as the Integrated Phase Classification (IPC) for Acute Food Security used to declare famine.9 We present an example of South Sudan to illustrate one feasible option of obtaining periodic, representative prevalence data in a particularly challenging setting.
Case of South Sudan emergency, 2014
Since independence in July 2011, South Sudan has suffered ongoing internal conflict. However, violence escalated in mid-December 2013 and as a consequence, the humanitarian situation markedly deteriorated.10 An estimated 740,000 persons were displaced and heavy fighting was reported in the capital, Juba, as well as in the greater Upper Nile region.11 In February 2014, the United Nations Emergency Relief Coordinator declared South Sudan in a Level 3 (L3) emergency, the highest level on the scale.12
The challenges of this context cannot be overstated. During this period, there was mass displacement of people who often were displaced repeatedly as the conflict moved. There was limited capacity in country to respond, particularly as staff were sheltered or evacuated with escalating conflict. These challenges exacerbated the vulnerability of a newly formed state with limited infrastructure and few formal institutions to provide assistance to the population. As the conflict persisted, people lost livelihoods, incomes and assets. Access to food was threatened, as was access to functional health centres and other basic services. Beginning in May 2014, the rainy season began limiting both access to these populations and food availability.
In May 2014, the IPCanalysis projected that 3.9 million people (34% of the total population) would be in crisis (IPC Phase 3) or facing emergency (IPC Phase 4) acute food insecurity levels from June through August 2014.13 Jonglei, Unity and Upper Nile States were the three most conflict-affected areas and accounted for about 56% of the total population classified as food insecure at IPC Phase 3 or 4 levels. Based on the experience from the FSNAU and the monitoring of the famine in two regions of Somalia during 2011 drought crisis in the Horn of Africa, Nutrition Technical Experts who contributed to that IPC analysis (including representatives from ACF, UNICEF, and the United States Centers for Disease Control and Prevention [CDC]) highlighted that there was a dire need for data to describe and track the evolving nutrition situation and to inform the acute food security IPC analysis. At this time, fears of a deterioration of the food security situation and potentially a famine (IPC Phase 5) in certain locations mounted as the lean season approached in July/August.
Within this context, nutrition surveillance activities were launched. Nutrition Cluster partners in South Sudan jointly developed a list of ten priority counties in Jonglei, Unity and Upper Nile States (from the 28 counties most affected by the conflict). Counties with no recent nutrition assessment were included and prioritised based on levels of insecurity, road access and flooding.14 To gather information in these priority counties, ACF launched the Surveillance and Evaluation Team (SET), funded by UNICEF and with technical support from CDC. The overall goal of this project was to monitor the nutrition status in the most food insecure areas to inform the national response, while setting up the foundations of a stronger and broader nutrition monitoring system country-wide. A secondary objective was to provide technical support, led by ACF, to all nutrition partners in country to ensure all data collection efforts produced high quality results.
To achieve the first goal, SET established a nutrition surveillance system in South Sudan through repeated rounds of Rapid Standardised Monitoring and Assessment of Relief and Transition (SMART) surveys.15
What is Rapid SMART and how was it used in SET surveillance in South Sudan?
South Sudan Nutrition Cluster survey recommendations were amended to allow for a more streamlined questionnaire and sampling strategy to be used in South Sudan per Rapid SMART guidelines. Rapid SMART is essentially a “normal” SMART survey following all the provisions of SMART guidelines with two key caveats:
- To minimise time required to collect data in the field (to adapt to extremely insecure or difficult to access settings and to focus on the quality of the key indicators – anthropometric measurements), the questionnaire is substantially shortened to include only anthropometry measurements (including both weight for height and mid-upper arm circumference [MUAC]) and a few additional indicators, e.g. child morbidity. All the other sectoral modules of indicators (water, sanitation and hygiene [WASH], food security, infant and young child feeding [IYCF], etc.) are excluded.
- To simplify sample size determination and minimise sample size requirements (to decrease time spent in the field while still achieving minimum precision for meaningful interpretation of results), Rapid SMART calls for a two-stage cluster design (25 clusters with 8-12 households per cluster, depending on percentage of children aged under-5 years in the population). This design produces a sample of 250 or more children aged under-5 years, which is sufficient in almost all situations (except where prevalence or design effect are very high) to achieve precision of +/-5% or less around the global acute malnutrition (GAM) estimate. When the mortality indicator is added to the survey, the sample size is increased to 30 clusters and about 420 households to achieve meaningful precision for mortality. In this particular case of South Sudan, mortality results were absolutely critical to assess the severity of the crisis and to inform the much-needed IPC analysis, since mortality is a required indicator for famine declaration.
Again, the indicators (a very limited number with few additional variables) and the “fixed” minimised sample size are the only key features that differentiate Rapid SMART from the traditional SMART methodology.16
ACF SET implemented repeated rounds of Rapid SMART surveys in three high priority counties: Leer County, Mayendit County (in Unity State) and Fashoda County (in Upper Nile State), which were outside of ACF operational areas.17 For the purpose of monitoring nutritional trends in these high risk counties, three rounds of surveys were planned: round 1 to immediately inform the situation (June, pre-harvest or lean season), and rounds 2 and 3 to take place throughout the rainy, harvest and post-harvest seasons at 2-month intervals. This relatively high frequency of survey rounds was based on the key lesson learned from the Somalia famine, i.e. the vulnerability of populations in critical situations can deteriorate extraordinarily quickly.18
Recognising early on that technical capacity in South Sudan would be a limiting factor, the SET included a secondary objective with two components to complement data collection and to contribute to strengthening of the South Sudan Nutrition Information Working Group (NIWG), a technical sub-group of the South Sudan Nutrition Cluster:
- Capacity Building – ACF worked with the NIWG to help build capacity of all implementing partners in the SMART methodology to enable them to design and implement nutrition surveys.
- Validation process – CDC worked with the NIWG to establish a process of data review (validation) to ensure partners in country had the skills to critically review and validate survey protocols and review and approve the quality of collected data before results were released.
Initial plans called for identifying partners to implement the nutrition surveillance system (Rapid SMART surveys) in all 10 priority counties. However, no additional partners could be identified. Partners reported that their ability to undertake the surveys outside their usual areas of operation was limited due to lack of funding, technical capacity, and concerns about insecurity and access. Assessments in the other seven priority counties were therefore never implemented.
 What results were obtained by SET?
Execution of surveys
A total of eight surveys were completed as part of the SET project over six months: three in Leer, three in Mayendit, and two in Fashoda. Data collection in Fashoda was interrupted during the second round (in October) after one day due to a security incident, resulting in evacuation of the team from the field.
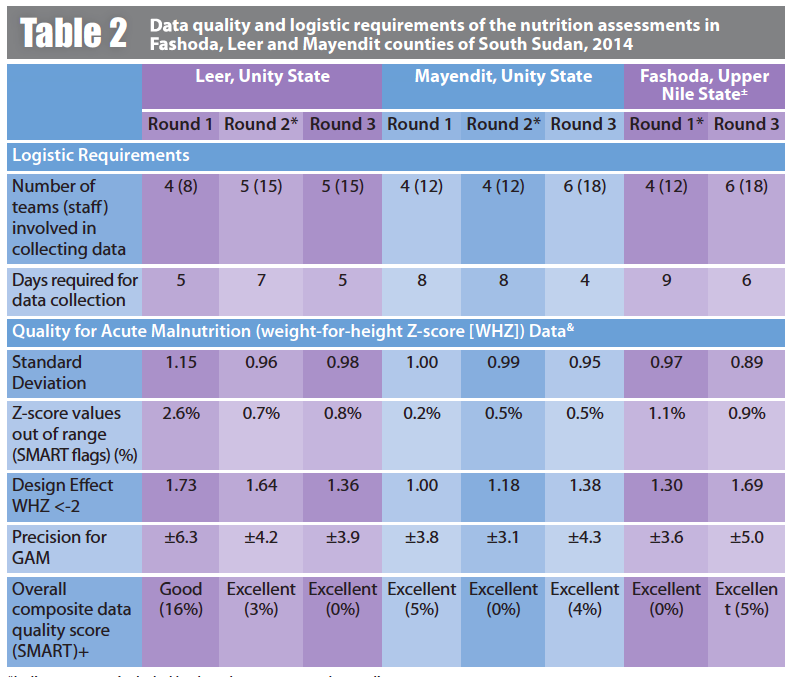
The sample sizes obtained for each survey are presented in Table 1. In all eight surveys, assessment teams successfully measured at least 350 children 6-59 months of age, well above the 250 minimum required. In most surveys, nearly twice that number of children was surveyed, likely due to lack of up-to-date demographic data and also to increases in household size related to recent large population movements due to insecurity and flooding. These sample sizes allowed for a precision of between ±3.1% (Mayendit Round 2) and ±6.3% (Leer, Round 1), in all cases acceptable precision to interpret the results (Table 2). The design effect for all surveys was relatively low19 indicating that the population in a given county was fairly homogeneous with regards to acute malnutrition.
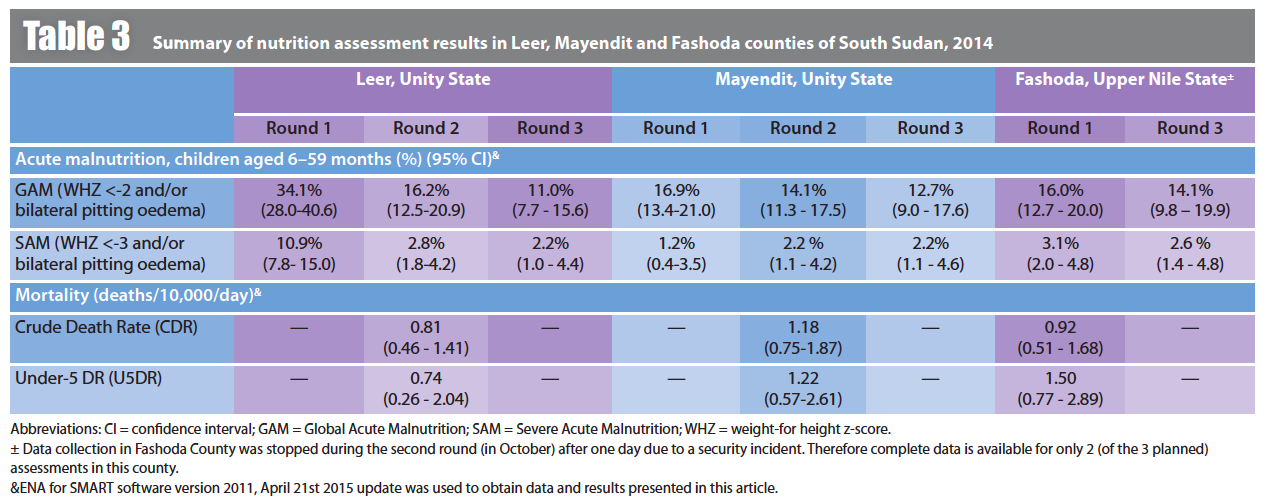
In all three settings, point estimates for prevalence of GAM remained in serious (10%-14%) or critical (>15%) categories throughout the assessment period (GAM in Leer in June was >30%, Table 3). It was observed in all counties surveyed that the prevalence of GAM declined throughout the year (Table 3). The most notable (and statistically significant) decline was in Leer, where prevalence of GAM declined from 34.1% (95% CI 28.0-40.6) at the end of June to 16.2% (95% CI 12.5-20.9) in September to 11.0% (95% CI 7.7-15.6) at the end of November. The marked reduction in GAM between the first and second rounds in Leer could be attributed to several factors including: i) seasonality, as people began to harvest in September; ii) increased availably of food in the markets, as major roads opened due to improved security; iii) food aid air drops; and iv) introduction of health, nutrition, WASH, and food security interventions by several partners in the area. Mortality was assessed once in each of the three counties. Crude Death Rate (CDR) ranged from 0.8/10,000/day (in Leer) to 1.2/10,000/day (in Mayendit), significantly below the emergency threshold, 2/10,000/day (Table 3).
Assessment methods were designed such that one team could complete two clusters per day. However, security and logistics (lack of road access to clusters by car) made this overall infeasible, and data collection required an average of 6.1 days of field work per survey (range 5 to 9 days, Table 2). The technical team at ACF supporting the SET surveys consisted of six SMART survey specialists and one SMART capacity building specialist (all international staff), as well as a logistician. Training of enumerators was undertaken over the course of 1-2 days. Field work was completed by between eight and 18 enumerators per survey working in teams of two to three enumerators (Table 2), each led by one SMART specialist. The SET had between 1 to 3 weeks between each round to finish the survey report, rest and prepare for the next survey. Preliminary results were shared with local authorities and partners the day after data collection at field level.
In terms of data quality, despite the major logistic and security challenges, the assessments were rigorous. Two key parameters used to assess nutrition survey data are the percent of extreme outliers (biologically implausible values) and standard deviation of z-scores.20 Across all surveys, less than 3.0% of children were excluded as extreme outliers applying the SMART recommended thresholds, <-3 or > 3 z-scores from the surveyed population.21 In five of the eight surveys, there were no outliers. Standard deviation of the weight-for-height z-scores (WHZ) is expected to be close to 1.0. Classified using the SMART thresholds, seven of the surveys had an excellent standard deviation (0.89-1.00), and one survey (Leer County, Round 1) had an acceptable standard deviation (1.15).22 Together these tests indicate that the quality of anthropometric measurement was high.

The sex ratio and age distribution (not presented) were analysed to assess whether the selected sample was representative of the general population. For all 8 surveys, age and sex distributions were as expected, indicating no selection bias. The overall composite SMART plausibility check quality score, which also takes into account several additional tests, indicated high quality data in all completed surveys.23
Use of the Rapid SMART method enabled SET to use the standard SMART software24 to assess the data quality and produce a preliminary report, a key advantage over other rapid methods. This enabled timely dissemination of results. For all rounds, a summary of key results was shared with the NIWG of the Nutrition Cluster, which reviews surveys in South Sudan, within 1 or 2 days of completing data collection; survey reports and datasets were shared within seven days.
Building SMART methodology capacities and strengthening survey validation process
As part of the SET, to build the capacity of partners in country including the Ministry of Health (MoH), one ACF SMART methodology expert was dedicated on a full-time basis to support all partners organizing nutrition surveys in their programme areas. This was prompted by a learning needs assessment, which demonstrated that the majority of agencies that had previous experience conducting surveys (11 of 15 agencies) used external human resources to carry out surveys. In most cases, external consultants were hired, which is both costly and introduces delays as the process of bidding and negotiating with consultants can often take weeks or months. Of the individuals who had received training on managing surveys, most reported that they were trained several years ago or that they were no longer in a position where carrying out surveys is their main work task. Among this group, many reported they did not have recent enough experience to feel confident in supervising a survey or critically reviewing surveys presented by their consultants or to the NIWG. Based on the results of the assessment, ACF organised and facilitated several SMART methodology trainings and subsequently trained 19 survey managers, enabling them to design surveys and critically review data quality.25 An additional 35 field supervisors were trained to be able to ensure rigor in the selection of households and measurement of children.
 In addition, support was provided directly to the NIWG to enable its members to play a meaningful role in prioritising survey areas, critically reviewing survey protocols, and technically assessing the validity and accuracy of survey data. This validation process was developed jointly with the MoH, UNICEF, CDC, and the ACF SMART expert. The process was modelled on the Kenya NIWG, which has been operating since 2008. Building the capacity of these partners included multiple intensive, 1 to 2-day technical information sessions for partners on reviewing the plausibility of survey results and interpreting data. NIWG members were also mentored for several months, during which time every survey completed in South Sudan was reviewed by the NIWG, CDC, and the ACF SMART expert who together discussed its quality. This ongoing work helped build the ability of NIWG to review the survey data. A secondary outcome was that datasets and preliminary reports were quickly validated and disseminated. This allowed for up-to-date information to be used by the NIWG for accurate programmatic decision making. Validated surveys were published on a regular basis on the South Sudan Humanitarian Response website.26 The results from the 8 rounds of the nutrition surveillance were among the highest quality of all the surveys reviewed by the NIWG together with the CDC and SMART expert.
The NIWG is recognised now as the established coordination body playing a key role in providing technical support to all partners, reviewing survey protocols, validating survey results, and interpreting data utilised by the Nutrition Cluster and other partners for both programme planning and situation analysis, e.g., IPC.
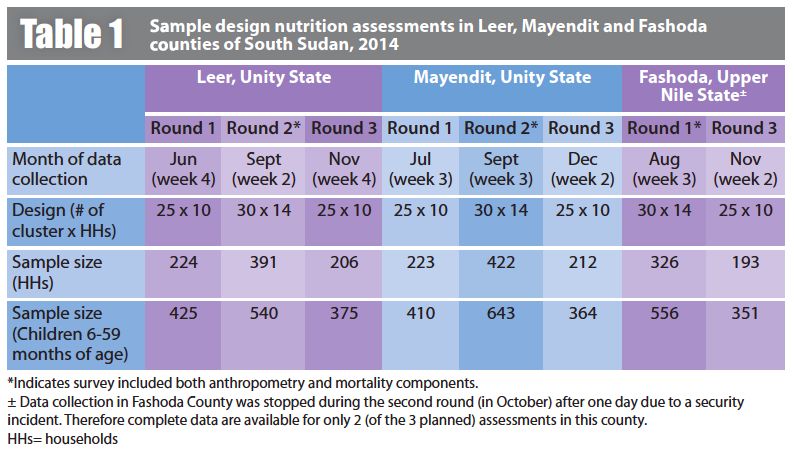
*Indicates survey included both anthropometry and mortality components.
± Data collection in Fashoda County was stopped during the second round (in October) after one day due to a security incident. Therefore complete data is available for only 2 (of the 3 planned) assessments in this county.
&ENA for SMART software version 2011, April 21st 2015 update was used to obtain data and results presented in this article.
+ SMART plausibility check data quality score is a composite score based on ten standardised statistical tests of data quality.
HHs= households
In view of the challenges faced and lessons learned, is this nutrition surveillance system a replicable model?
The implementation of the SET model in South Sudan convincingly demonstrated that high quality anthropometry data can be obtained even in the midst of an ongoing conflict using the Rapid SMART method. The survey data presented here are of excellent quality, as assessed by all standard parameters. The data has been validated by the NIWG in country, as well as by technical experts at the CDC and ACF. This is an important proof of concept, and a counterpoint to those suggesting that only MUAC assessments are feasible in these contexts.
The model also helped minimise risk to the assessment teams. The streamlined approach enabled teams to spend less than 10 days collecting data for all assessments. By comparison, data collection during SMART surveys carried out in South Sudan in 2013-14 took up to 32 days (average 11.6 days).27 The time required for training of enumerators was also reduced, as the same ACF SET field supervisors assisted by locally recruited enumerators took anthropometric measurements in each round, so that there was no need for the standard 5-day training and standardisation test prior to each round. For this standing team of highly trained individuals, enumerator training was reduced to 1 or 2 days. Conversely, data collection was far from being rapid, even though from round 2 onwards the number of survey teams was increased from 4 to 5 to sometimes 6 teams (Table 2). This was mainly because of access and terrain challenges; survey teams could not complete two clusters per day per team as was originally planned.
However, in evaluating the replicability of the model, there are several other factors to consider – first of which is technical capacity. The major barrier to implementing this model was the lack of agencies with in-house capacity for designing surveys and reviewing data quality. As mentioned, the surveillance system was designed to produce estimates of prevalence of acute malnutrition for the 10 priority counties identified during the May 2014 IPC assessment. The plan presumed two to three agencies would collect the data that could inform national decision making; 10 counties exceeded the capacity of ACF SET operating alone. However, despite the simplifications made, e.g. fixed sample size, and the external technical support (from ACF, UNICEF, and CDC), no other partners were identified to support this activity. Replication of this model, or any other cross-sectional survey model, to obtain nutrition surveillance data depends on building the capacity of partners working in these challenging settings.
The other major challenge was related to logistics and access. The rainy season lasts in South Sudan anywhere from May to October, and significant flooding and poor road networks impacted access to certain parts of the selected counties, especially during the first two rounds of surveys. Many roads were washed out. Teams had to walk up to three hours each way to access certain villages. Time spent travelling to each cluster was often longer than the time spent in a village undertaking data collection. In Mayendit, the lack of road networks due to flooding meant that only the northern payams of this county accessible from a road in the north in neighbouring Leer County, could be visited by the survey teams during the first two rounds. The southern payams were accessed by a chartered flight only in the third round. In Fashoda, teams reached certain clusters using a chartered speed boat. However, in other areas, survey teams relied on make-shift rafts that they constructed to facilitate their movements between selected clusters. A helicopter was also used to move teams during round 2 in Fashoda in order to increase the number of accessible villages. Fuel shortages further challenged data collection. For surveys in Leer County, fuel for cars was sent to the teams by plane from Juba. Limited fuel supply was only sufficient for 1 car, requiring all four teams to share a vehicle. While various means of transportation were used to maximize access to villages, fighting that erupted in Fashoda prevented the teams from completing the second survey round in that county (October 2014). Access was further restricted due to insecurity resulting from the ongoing conflict. For the surveys, the SET was sometimes deployed to opposition-controlled areas. Several rounds of negotiations with local authorities were required to obtain approval for undertaking surveys in these areas. Given these conditions, any other methods of surveillance data collection would have likely broken down completely. Facility-based surveillance would not be feasible; in most of the areas visited, there were no functional health centres and those that existed were unable to regularly communicate information for national aggregation. Very few areas had ongoing nutrition treatment programmes, limiting the utility of their data for monitoring the situation. Therefore, we suggest that while logistics and access were major barriers in all three counties that delayed the assessments and affected their cost, this model is the only one that was able to be used to gather actionable information in these conditions.
The SET had to address other challenges. First, accurate population data at the village level during an ongoing crisis were limited. The South Sudanese population at that time was experiencing mass migration. Some clusters were significantly larger than expected as they were hosting displaced persons, while others had countless empty homes. In certain cases, only women and children fled villages. However, the SET was able to work with local authorities to update sampling frames for nearly all villages, though this sometimes required several days of work with local leaders to ensure village lists and population figures were up to date.28 Underestimating the target population where there was uncertainty in population data helped ensure enough children were measured in each cluster. Second, recruitment of skilled survey teams was more challenging in South Sudan than in other settings, and threatened to affect the implementation of the SET model. Recruitment was cited by several agencies as a challenge that precluded them from participating in the assessments. ACF had success in recruiting young professionals to build the SET. These professionals, some of whom had never been exposed to an international or emergency context, were extremely motivated and under a strong leadership and close technical support.
This nutrition surveillance system, though limited to three counties, was successful for a variety of reasons. In the initial stages, there was adequate planning, funding, and, importantly, collaboration with all relevant stakeholders. In the implementation stages, the surveillance was successful due to teams working closely with local authorities for access to population data and facilitation of movements, timely recruitment of qualified staff, rigorous training of field enumerators, and dedicated logistical support. Finally, close supervision of data collection, and capacity building for data analysis and interpretation of results were the basis for a long-term in-country survey validation system.
Limitations of these repeated rounds of Rapid SMART surveys were akin to those undertaken in any emergency situation: fluctuating populations (in- and out-migrations) leading to inaccurate population figures, and fluctuating access to areas within each county. However, the SET demonstrated that high quality, representative anthropometric and mortality assessments are feasible in areas with significant access and security constraints. The budgets of these Rapid SMART surveys were in most rounds comparable to any other SMART surveys, with survey costs ranging from around USD 5,000 to USD 20,00029 (on the higher end when mortality data were included). However, in two rounds, the survey cost was around USD 100,000 due to use of charter planes, helicopter, speed boats, and purchase of electronic devices for digital data collection. These costs could have been avoided or minimised if stronger nutrition survey capacities (both for execution and coordination/validation of surveys) existed before the start of the conflict. It is possible that if partners were more willing and prepared to engage in surveillance, the first round of surveys could have begun slightly earlier prior to rainy season and costs would have been reduced.
The results obtained in Leer County between June and September 2014, showed how important it is to have a surveillance system that detects rapid changes, especially given the dynamic fluctuation one may observe with the prevalence of GAM. The data generated by this surveillance system were key in providing an accurate picture of the situation. SET survey results were largely used in the subsequent IPC analysis, and also allowed humanitarian actors to get a sense of the impact of their interventions.
The importance of nutrition information in areas of high insecurity cannot be overemphasised. If nutrition survey capacity issues are addressed (for both execution and coordination/validation of surveys), the SET process described here could be used as a model for nutrition surveillance in other emergency contexts. However, in order for this type of nutrition surveillance system to be replicated, either inside South Sudan or elsewhere in an emergency situation, more partners need to be capable and willing to scale-up assessments in volatile emergency areas.
For more information, contact: Cécile Basquin, Nutrition & Health Technical Advisor, Action Against Hunger | ACF-USA, 247 West 37th Street, 10th Floor New York, NY 10018 USA Phone: + 1-212-967-7800 x110; email: cbasquin@actionagainsthunger.org
1Bilukha O, Prudhon C, Moloney G, Hailey P, Doledec D (2012). Measuring anthropometric indicators through nutrition surveillance in humanitarian settings: Options, issues and ways forward. Food and Nutrition Bulletin, vol. 33, no.2, pp169-176.
2For more information, see the FSNAU web site: http://www.fsnau.org/
3Salama, P. et al (2012). Famine in Somalia: Evidence for a declaration. Global Food Security (2012), http://dx.doi.org/ 10.1016/j.gfs.2012.08.002
4Note that ACF also has an ongoing approach in the Democratic Republic of Congo that allows identification of nutrition crises, and ACF led integrated surveillance systems notably in certain parts of Kenya and Uganda with high recurrent levels of malnutrition.
5National Institute for Occupational Safety and Health (NIOSH) 2012, Surveillance. Available from: http://www.cdc.gov/niosh/programs/surv/
6There are five major methodological approaches to nutrition surveillance design: repeated surveys, community-based sentinel sites, periodic exhaustive screenings, admission data from feeding programmes for moderately and severely malnourished children, and anthropometric data from health clinics (Bilukha, et al, 2012).
7Nnyepi M, Kesitegile SM Gobotswang, Codjia P, 2011. Comparison of estimates of malnutrition in children aged 0-5 years between clinic-based nutrition surveillance and national surveys. Journal of Public Health Policy, vol. 32, no. 3, pp 281-292.
8Grellety E, Luquero F, Mambula C, Adamu H, Elder G, Porten K, 2013. Observational Bias during Nutrition Surveillance: Results of a Mixed Longitudinal and Cross-Sectional Data Collection System in Northern Nigeria. PLoS ONE, vol. 8, no. 5, pp 1-11.
9Integrated Food Security Phase Classification (IPC) 2012. IPC and Famine. Available from: http://www.ipcinfo.org/ipcinfo-detail-forms/ipcinfo-resource-detail0/en/c/178965/
10UNICEF 2014, South Sudan Situation Report, 11 February 2014. Available from: http://www.unicef.org/appeals/files/UNICEF_South_Sudan_SitRep9_11FEB2014.pdf
11OCHA 2014, South Sudan Crisis: Humanitarian Snapshot as of 31 January 2014. Available from: http://reliefweb.int/report/south-sudan/south-sudan-crisis-humanitarian-snapshot-31-january-2014
12UNICEF 2014, South Sudan Situation Report, 11 February 2014. Available from: http://www.unicef.org/appeals/files/UNICEF_South_Sudan_SitRep9_11FEB2014.pdf
13Integrated Food Security Phase Classification (IPC) 2014. Current Acute Food Insecurity Overview in South Sudan May 2014. Available from: http://www.ipcinfo.org/ipcinfo-detail-forms/ipcinfo-map-detail/en/c/234337/
14The 10 counties that are high priority change semi-regularly as response progresses. South Sudan Nutrition Cluster 2014, South Sudan Updated Nutrition Cluster Response Plan – August 2014. Available from: https://www.humanitarianresponse.info/en/operations/south-sudan/document/ssudan-updated-nutrition-cluster-response-plan-final-draft-1-sep
15SMART Methodology 2014, Rapid SMART Guidelines. Available from: http://smartmethodology.org/survey-planning-tools/smart-methodology/rapid-smart-methodology/
16 SMART Methodology 2006, SMART Methodology Manual. Available from: http://smartmethodology.org/survey-planning-tools/smart-methodology/
17ACF chose these three countries out of the list of 10 priority counties for feasibility reasons, after careful assessment of security, access, road network, and availability of transportation means, among other parameters set by the ACF logistics staff.
18Hillbruner,C.,Moloney,G.. When early warning is not enough—Lessons learned from the 2011 Somalia Famine. GlobalFoodSecurity (2012), http://dx.doi.org/10.1016/j.gfs.2012.08.001
19Design effect ranged from 1.00 in Mayendit round 1 to 1.81 in Fashoda round 2.
20WHO 1995. Physical Status: The Use and Interpretation of Anthropometry. Available from: http://www.who.int/childgrowth/publications/physical_status/en/
21SMART Methodology 2006, SMART Methodology Manual. Available from: http://smartmethodology.org/survey-planning-tools/smart-methodology/
22Acceptable range of standard deviation is 0.80-1.20. SMART Methodology Manual, 2006. Available from: http://smartmethodology.org/survey-planning-tools/smart-methodology/
23SMART plausibility check data quality score is a composite score based on ten standardized statistical tests of data quality.
24ENA for SMART 2015. Available from: http://smartmethodology.org/survey-planning-tools/smart-emergency-nutrition-assessment/
25Of the individuals (from MoH, UN agencies, NGOs, etc.) trained as survey managers, four participated as active members of the NIWG and several additional individuals organised surveys for their NGOs within and after the SET project period. Two of the participants trained as survey managers were part of the SET.
26Nutrition Information Working Group 2015, South Sudan SMART Survey Summary Matrix. Available from: http://www.humanitarianresponse.info/en/operations/south-sudan/document/final27012015ssd-smart-survey-summary-matrix.
27Nutrition Information Working Group 2015, South Sudan SMART Survey Summary Matrix. Available from: http://www.humanitarianresponse.info/en/operations/south-sudan/document/final27012015ssd-smart-survey-summary-matrix.
28Sampling frames were updated before every survey due to frequent population movements.
29Includes survey staff (enumerators), training, data collection kit (materials) and transport costs.