
Comparison of LQAS and 30-by-30 two-stage cluster sampled survey method for the assessment of coverage indicators
 By Asrat Dibaba, Charles Chimombo, Ari Uotila, Whitney King and Mark Myatt
Asrat Dibaba is the Maternal, Newborn and Child Health Advisor for World Vision East Africa Region based in Nairobi. He has worked in Ethiopia, Liberia, Sudan and Cambodia.
Charles Chimombo is the Monitoring and Evaluation Manager for World Vision Malawi. He has worked with MSF, Project Hope, UNHCR and the government of Malawi.
Ari Uotila is the Programme Quality Assurance Lead for International Programmes, World Vision Canada. Ari has worked in international development for 28 years with primary field experience in Africa.
Whitney King is a Programme Research Analyst for World Vision US based in Washington, DC.
Mark Myatt is a consultant epidemiologist. His areas of expertise include surveillance of communicable diseases, epidemiology of communicable diseases, nutritional epidemiology, spatial epidemiology, and survey design. He is currently based in the UK.
The authors declare that they have no competing interest.
The authors acknowledge the contributions of Abena Thomas, Holta Trandafili, Paulaw Kitheka and WV Malawi staff who participated in this work.
Location: Malawi
What we know: The 30-by-30 two-stage cluster survey is commonly used for programme monitoring and evaluation. It takes time, resources and expert supervision and support. The Lot Quality Assurance Sampling (LQAS) technique has been used in different contexts and settings for measuring programme performance.
What this article adds: A 30-by-30 two-stage cluster sampled survey was prospectively compared with an LQAS survey (19 observations in five supervision areas) in the same World Vision programme area in Malawi. Both methods provided wide-area estimates with useful precision. As expected, the LQAS survey confidence intervals were wider than the 30-by-30. However, the two surveys returned very similar estimates for eight out of nine indicators. The LQAS survey method was significantly cheaper than the 30-by-30 cluster survey (31% of data collection, data entry and travel costs).
Introduction
In World Vision’s development programmes, the 30-by-30 two-stage cluster sampled design is the standard survey method used for monitoring and evaluation assessments and is used in many countries where World Vision is operational1. The 30-by-30 cluster method is often perceived as being complex, expensive and time consuming by field programme staff. Most field surveys employing this survey method are supervised and analysed by external consultants. This tends to limit ownership of the process, data, or results by local programme staff and community. Programming at the ground level could be improved if programme staff had access to quick, inexpensive and simple information about key programme indicators. This information could then be used in timely monitoring and management of programmatic interventions. In this article, the potential of the Lot Quality Assurance Sampling (LQAS) technique to provide inexpensive and programmatically useful information at the community level is explored and compared with the 30-by-30 two-stage cluster sampling technique.
The LQAS survey method used in the work described in this report is increasingly being used for measuring programme performance2,3. This is largely due its simplicity and its ability to provide results quickly and cheaply2,3. Assessments in Nepal have shown that an LQAS survey can be completed at about one quarter of the cost of a 30-by-30 two-stage cluster sampled survey4. LQAS has been used to assess coverage of immunisation services in India5. In Armenia, Malawi, and Nicaragua, networks of non-governmental organisations (NGOs) have used LQAS surveys to track national disaster relief and reproductive health programmes6. In Uganda, LQAS surveys have been used to assess the performance of HIV / AIDS control programmes at the sub-district, district, and national level7.
The LQAS survey method used in the work described here employs a stratified sampling design in which small samples, randomly selected from each of several supervision areas (SAs), are used to classify coverage or prevalence in each supervision area as being either acceptable or unacceptable based upon a simple count of the number of sampling units with (or without) the characteristic of interest. The data collected from the strata may be combined and a wide-area estimate calculated8. When this is done, the LQAS method provides both a wide-area estimate and small-area classifications.
 The LQAS survey method can provide an alternative to traditional cluster sampled surveys. For example, LQAS designs have been shown to provide a statistically rigorous alternative to the more time-consuming and expensive SMART survey method (also a two-stage cluster-sampled design) that is commonly used to assess the prevalence of acute malnutrition9,10. The SQUEAC and SLEAC coverage assessment methods use LQAS to test hypotheses about programme coverage, to classify programme coverage at the level of the service delivery unit, and to estimate coverage over wide areas11. LQAS designs have been shown to provide comparable wide-area estimates to standard 30-by-7 Expanded Programme on Immunisation (EPI) surveys, as well as providing maps of local classifications of vaccine coverage5.
In the work reported here, a 30-by-30 two-stage cluster sampled survey, in which n = 30 observations were collected from each of m = 30 clusters, was compared with a LQAS surveys, in which n = 19 observations were collected from each of m = 5 supervision areas (strata). All surveys were of the same programme area.
Methods
Background
The study was conducted in Chamba Traditional Authority, Machinga district, Malawi where World Vision is implementing an integrated development programme with five project areas (i.e. education, health, nutrition, sponsorship management, and child protection). The programme is in the third year of the first phase of the programme cycle for the nutrition project, which includes early childhood development and emergency-response sub-projects. The programme uses both community-based home-visitor and care-group models. The programme area has a population of 10,790 people in 2,158 households12. Nine indicators (see Table 1) measuring the progress of programme implementation were assessed and results of the two survey methods compared.
| Table 1: Estimates returned by the different survey methods | ||||
|
|
|
Method
|
|
|
|
|
Indicator | 30-by30 | LQAS | p-value* |
| 1 | Safe source of water (dry season) | 88.3% [86.1%; 90.5%] | 87.9% [81.3%; 94.5%] | 0.9102 |
| 2 | Safe source of water (wet seasons) | 90.1% [88.1%; 92.1%] | 89.3% [83.1%; 95.5%] | 0.8098 |
| 3 | Proportion of children aged 12-23 months who have received Penta-3 vaccine | 96.5% [94.7%; 98.3%] | 96.7% [93.1%; 100.0%] | 0.9197 |
| 4 | Proportion of children aged 12-23 months who are immunized against measles | 95.5% [93.3%; 97.7%] | 97.3% [94.0%; 100.0%] | 0.6734 |
| 5 | Proportion of children aged 6-18 years who are currently enrolled in and attending a structured learning institution | 93.7% [91.9%; 95.5%] | 91.2% [85.5%; 96.9%] | 0.4124 |
| 6 | Proportion of respondents who believe that child sponsorship is only for sponsored children and has nothing to do with non-sponsored children | 65.7% [62.6%; 68.8%] | 54.0% [44.0%; 64.0%] | 0.0285 |
| 7 | Proportion of respondents who believe that World Vision should spend more money on families who are registered in the child sponsorship program rather than on community development projects | 60.0% [58.1%; 63.2%] | 55.8% [45.8%; 65.8%] | 0.4251 |
| 8 | Proportion of respondents who believe that child sponsorship unites rather than divides the community | 89.0% [87.0%; 91.1%] | 84.2% [76.9%; 91.5%] | 0.2147 |
| 9 | Proportion of respondents who believe that child sponsorship helps in the development of their communities | 89.6% [87.6%; 91.6%] | 83.5% [76.0%; 91.0%] | 0.3906 |
* p-value for a Wald type test with a null hypothesis of no difference between estimates returned by the two survey methods.
Survey procedures
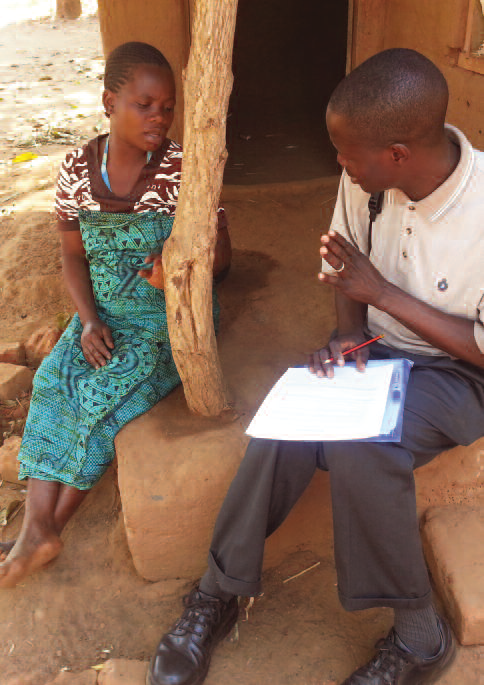
A modified (i.e. the within-cluster sample size was increased from seven to thirty) version of the World Health Organisation (WHO) EPI methodology’, was used for the 30-by-30 cluster survey9,13,. Thirty primary sampling units (clusters) were selected from a list of all villages in the programme area using population proportional sampling (PPS)9,13,14. Thirty households were selected from each cluster using the standard EPI proximity sampling method9,13,14. The first household was selected by randomly choosing a direction (i.e. by spinning a bottle) at a central location in the village and counting the households in that direction from the centre to the edge of the village. The first household was selected at random from households along the selected direction. Interviewers proceeded to the nearest household until the within-cluster sample size (n = 30) was met. At total sample size of n = 900 was collected.
The LQAS surveys covered the same programme area as the 30-by-30 surveys. The programme area was divided into five contiguous and non-overlapping areas. The programme area covered three administrative divisions of Chamba district. The two largest administrative divisions were divided into two approximately equal areas yielding five supervision areas from three administrative divisions (see Map 1). The village locations from which nineteen respondents would be randomly selected were identified from each of the five supervision areas using the same list of villages and PPS. With this, the number of households per village selected for this exercise ranged from one household up to nine. A total of 95 households for each target population of interest in the survey were selected from the entire survey area. Each household was selected from the villages using the random selection method used to find the first household in the 30-by-30 cluster survey. A total sample size of n = 95 was collected.
Three parallel LQAS surveys were conducted among different target groups. One survey of children aged between six and eighteen years assessed education-related indicators. A second survey assessed immunisation coverage in children aged between twelve and twenty-three months. A third survey assessed sponsorship indicators in households with children between birth and eighteen years of age.
The enumerators used for both (i.e. 30-by-30 and LQAS) survey methods were high school teachers with prior experience in data collection and educated to diploma level or higher. Enumerators were trained for two days on household selection procedures and administration of the survey questionnaires. Enumerators were randomly assigned to a survey method and World Vision’s Design Monitoring and Evaluation (DME) co-ordinators worked with each team as supervisors.
All surveys were conducted simultaneously between August 28th -30th, 2013. The survey respondents were mothers / principal carers of children in the sampled households. For children aged between twelve and twenty-three months, enumerators checked vaccination history from health cards and used maternal report only when cards were not available.
The study afforded the opportunity to compare time and costs for the 30-by-30 and LQAS survey methods under the similar circumstances (i.e. in terms of location, wage levels, and other costs). The cost components of the surveys expected to be most affected by the different methodologies and sample sizes were data collection, data entry, travel costs, and printing costs. Enumerators were asked to complete logs that captured both travel time and the time needed to select eligible households and the time needed for conducting interviews. These logs were used to determine the number of person-hours required to complete the 30-by-30 and LQAS surveys.
Statistical analysis
Data were entered, checked cleaned and analysed using SPSS and Microsoft Excel. For data from the 30-by-30, survey estimates of indicator levels and associated 95% confidence intervals were calculated for the entire programme area using SPSS Complex Samples. The use of a proximity sample in the second stage of the 30-by-30 survey meant that accurate and reliable cluster-level classifications could not be made. For LQAS data, estimates of indicator levels were calculated for the entire programme area by taking into account populations of the supervision areas using the direct adjustment method8. Estimates from the two survey methods were compared using a Wald type test statistic15:

The variance of the difference between the two estimates was calculated using the survey estimates and their associated 95% confidence limits. This approach was used as it accounts for design effects in the two surveys.
Programme performance in each supervision area was classified as adequate or poor for three indicators using LQAS decision rules created using tables commonly used for international development programmes with both consumer error and provider error fixed at less than 10%7.
Daily time logs completed by the enumerators were examined to assess the feasibility of the two survey methods. Data entry clerks were assigned to either enter 30-by-30 survey or LQAS survey data and person-days were determined based on the assigned and the completed workloads. Drivers also completed travel logs tracking the distances covered in transporting enumerators to and from the villages where data were collected. Finally, the number of pages printed for each set of surveys was determined and a set price per page was used to estimate the cost of printing.
Results
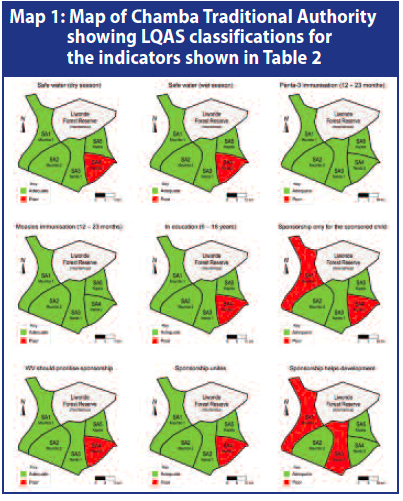
Comparisons of the estimates of indicator levels found in the two surveys are shown in Table 1. The two surveys returned very similar estimates for eight out of nine indicators. The confidence intervals from the LQAS survey were wider than those from the 30-by-30 survey. This was expected as the sample sizes differed by almost an order of magnitude. Programme performance classifications for the nine indicators are shown in Table 2 (results are also shown in Map 1). Cost comparison data are shown in Table 3. The overall cost of the LQAS survey was about a third of the cost of the 30-by-30 cluster survey. While the time spent to complete one sample was 60% more (32 minutes versus 20 minutes) in the LQAS approach, the overall time spent in the LQAS survey was 173 person-hours compared to 540 person-hours with the 30-by-30 cluster survey.
| Table 2: LQAS classification for each supervision area | |||||||
|
|
|
|
Supervision Area
|
||||
|
|
Indicator
|
Attribute
|
1
|
2
|
3
|
4
|
5
|
| 1
|
Safe source of water (dry season)
|
Triage levels*
|
60% / 90% (CPE, PPE ≤ 10%)
|
||||
| Successes
|
18
|
19
|
18
|
10
|
18
|
||
| Decision rule**
|
Number of successes ≥ 15
|
||||||
| Classification
|
OK
|
OK
|
OK
|
Poor
|
OK
|
||
| 2
|
Safe source of water (wet seasons)
|
Triage levels*
|
60% / 90% (CPE, PPE ≤ 10%)
|
||||
| Successes
|
18
|
19
|
19
|
10
|
18
|
||
| Decision rule**
|
Number of successes ≥ 15
|
||||||
| Classification
|
OK
|
OK
|
OK
|
Poor
|
OK
|
||
| 3
|
Proportion of children aged 12-23 months who have received Penta-3 vaccine
|
Triage levels*
|
65% / 95% (CPE, PPE ≤ 10%)
|
||||
| Successes
|
19
|
19
|
19
|
18
|
17
|
||
| Decision rule**
|
Number of successes ≥ 16
|
||||||
| Classification
|
OK
|
OK
|
OK
|
OK
|
OK
|
||
| 4
|
Proportion of children aged 12-23 months who are immunized against measles
|
Triage levels*
|
65% / 95% (CPE, PPE ≤ 10%)
|
||||
| Successes
|
19
|
19
|
19
|
19
|
19
|
||
| Decision rule**
|
Number of successes ≥ 16
|
||||||
| Classification
|
OK
|
OK
|
OK
|
OK
|
OK
|
||
| 5
|
Proportion of children aged 6-18 years who are currently enrolled in and attending a structured learning institution
|
Triage levels*
|
65% / 95% (CPE, PPE ≤ 10%)
|
||||
| Successes
|
18
|
19
|
18
|
15
|
17
|
||
| Decision rule**
|
Number of successes ≥ 16
|
||||||
| Classification
|
OK
|
OK
|
OK
|
Poor
|
OK
|
||
| 6
|
Proportion of respondents who believe that child sponsorship is only for sponsored children and has nothing to do with non-sponsored children
|
Triage levels*
|
30% / 60% (CPE, PPE ≤ 10%)
|
||||
| Successes
|
8
|
16
|
12
|
5
|
13
|
||
| Decision rule**
|
Number of successes ≥ 9
|
||||||
| Classification
|
Poor
|
OK
|
OK
|
Poor
|
OK
|
||
| 7
|
Proportion of respondents who believe that World Vision should spend more money on families who are registered in the child sponsorship program rather than on community development projects
|
Triage levels*
|
25% / 55% (CPE, PPE ≤ 10%)
|
||||
| Successes
|
11
|
11
|
11
|
6
|
13
|
||
| Decision rule**
|
Number of successes ≥ 8
|
||||||
| Classification
|
OK
|
OK
|
OK
|
Poor
|
OK
|
||
| 8
|
Proportion of respondents who believe that child sponsorship unites rather than divides the community
|
Triage levels*
|
55% / 85% (CPE, PPE ≤ 10%)
|
||||
| Successes
|
16
|
15
|
18
|
12
|
17
|
||
| Decision rule**
|
Number of successes ≥ 14
|
||||||
| Classification
|
OK
|
OK
|
OK
|
Poor
|
OK
|
||
| 9
|
Proportion of respondents who believe that child sponsorship helps in the development of their communities
|
Triage levels*
|
65% / 95% (CPE, PPE ≤ 10%)
|
||||
| Successes
|
15
|
19
|
15
|
17
|
16
|
||
| Decision rule**
|
Number of successes ≥ 16
|
||||||
| Classification
|
Poor
|
OK
|
Poor
|
OK
|
OK
|
||
* Triage levels are the upper threshold of the indicator level considered to be “poor” and the lower threshold of the indicator level to be considered OK. Triage levels of “60% / 90%” define “poor” as below 60% and “OK” as above 90%. Indicator levels between the triage levels are classifies as either “poor” or “OK” with a probability that depends upon the proximity of the indicator level to the triage levels. The figures in brackets refer to classification errors. Provider Probability of Error (PPE) is the risk that the survey will return a “poor” classification when the true classification is “OK”. A provider error may lead you to divert resources to a supervision area that does not need them. Consumer Probability of Error (CPE) is the risk that the survey will return an “OK” classification when the true classification is “poor” A consumer error will leave poorly performing supervision areas undetected. Both CPE and PPE were set at ≤ 10% for all indicators.
** The LQAS decision rule that matches the triage levels and error levels with a sample size of n = 19. When more than one decision rule met the triage / error criteria the decision rule with the lowest CPE was used.
| Table 3: Cost comparison of the two survey methods | ||||||
|
|
|
Survey Method |
|
|
||
|
Activity |
LQAS |
30-by-30 |
Ratio LQAS : 30-by-30 |
|
||
|
Data collection |
Per sample |
32 minutes |
20 minutes |
160% |
* |
|
|
Overall |
173 person-hours |
540 person-hours |
32% |
** |
||
|
Data entry |
Overall |
3 person days |
12 person days |
25% |
|
|
|
Distance travelled |
Overall |
345 km |
1001 km |
34% |
*** |
|
|
Data collection and entry costs |
Overall |
1426.45 USD |
4563.58 USD |
31% |
|
|
* These per-sample averages are derived from the enumerators’ logs which recorded the time spent in the village required to collect the entire village sample. The result given is the time spent in the village divided by the number of samples taken from the village. Problems with the completeness of enumerators’ logs means that the cited per-sample average is based on incomplete data: 86% (776 from a possible 900) of the 30-by-30 sample and 73% (70 of a possible 95) of the LQAS sample were used. The cited per-sample averages are to complete one 30-by-30 sample and one complete set of the three parallel LQAS samples.
** The overall amount of time taken for data-collection was calculated from the supervisors’ logs for time spent in the field (the time they left the base until the time they returned to base minus the time spent for lunch).
*** The difference is due to reduction in numbers of return-to-base journeys required to complete the surveys.
 Discussion
In this study, there was no statistically significant difference between the estimates returned by the two survey methods except for one indicator. This indicator was a knowledge-attitude-practice (KAP) type question and such questions are often unreliable and sensitive to the approach of the interviewer. This statistically significant difference was not, however, a functionally significant difference in the sense that both results were below a level deemed by programme managers to be acceptable.
The LQAS survey method is capable of providing more information than the 30-by-30 method. Both methods provided wide-area estimates with useful precision (see Table 1). The LQAS survey method also provided small-area classifications and, in the study reported here, identified a supervision area that was failing to achieve adequate coverage on three indicators (see Table 2 and Map 1). The LQAS survey method was also found to be significantly cheaper than the 30-by-30 survey method.
Conclusions
In this study the LQAS survey method was found to provide more information at lower cost than the 30-by-30 survey method. Programme managers should seriously consider using the LQAS survey method for monitoring and evaluation purposes.
For more information, contact: Asrat Dibaba, email:asrat_dibaba@wvi.org
1Transformational Development Indicators, field guide, World Vision, 2005.
2Valadez, J. J. 1991. Assessing Child Survival Programs in Developing Countries: Testing Lot Quality Assurance Sampling. Cambridge: Harvard University Press.
3Lanata, C.F. & Black, R.E. Lot quality assurance sampling techniques in health surveys in developing countries: advantages and current constraints. World health statistics quarterly, 44: 133-139 (1991).
4Espeut D. Unpublished [2000]. Effective monitoring with efficient methods. PLAN/Nepal's experience with LQAS in project monitoring. 18 p.
5Singh, J, et al (1996). Evaluation of Immunisation Coverage by Lot Quality Assurance Sampling Compared with 30-Cluster Sampling in a Primary Health Care Centre in India. Bulletin of the World Health Organisation 74.
6Valadez J, Weiss W, Leburng C, Davis R (2001). Using LQAS for assessing Field Programs in Community Health in Developing Countries. NGO Networks for Health, Washington DC, 2001.
7Mukaire, J.P, Kisitu, K.D, Sekamatte-Sebuliba, B.J, Valadez, J.J (2004). LQAS Monitoring Report: Assessment of HIV/AIDS Related Knowledge, Practices and Courage in 19 Districts of Uganda.
8Valadez JJ, Weiss B, Leburg C, Davis R (2003). Assessing Community Health Programmes: using LQAS for baseline surveys and regular monitoring. London: Teaching-aids at Low Cost, 2003.
9Standardised Monitoring and Assessment of Relief and Transitions (SMART). Measuring mortality, nutritional status and food security in crisis situations. 2006.
10Deitchler M, Valadez JJ, Egge K, Fernandez S, Hennigan M (2007). A field test of three LQAS designs to assess the prevalence of acute malnutrition. Int J Epidemiol. 2007;36:858–64.
11Guevarra E, Guerrero S, Myatt M (2012). Using SLEAC as a wide-area survey method, Field Exchange, 2012;42:39-44
12Malawi (2008). Population and Housing Census, National Statistic Office, Zomba, Malawi
13World Health Organisation Training for Mid-level Managers: The EPI Coverage Survey. Geneva: WHO Expanded Programme on Immunisation, 1991 WHO/EPI/MLM/91.10
14Lemeshow S, and Robinson D (1985). Surveys to measure programme coverage and impact: a review of the methodology used by the Expanded Programme on Immunisation. World Health Statistics Quarterly 38, 65-75, 1985.
15Agresti, A (2002). Categorical Data Analysis (2nd ed.). Wiley.