
The state of global SAM management coverage 2012
 Summary of report1
Thanks to Saul Guerrero, ACF-UK, for preparing this article.
Location: Global
What we know: Geographical coverage and treatment coverage are needed to evaluate SAM management coverage. These can be directly or indirectly measured.
What this article adds: The 2012 Global SAM Management Update found improved reporting on geographical coverage (49 out of 60 countries) and most (86.6%) were able to report treatment coverage using indirect national estimates. Only 14 countries out of the 60 in 2012 were aiming for country-wide scale up. Indications are that indirect national estimates are overestimating achieved treatment coverage and give no indication of variation in coverage. Direct coverage surveys have advantages in this regard but limitations too. Other factors (barriers) influence SAM service update.
’The State of Global SAM Management Coverage 2012’, an annex to the Global SAM Management Update (see news piece), was produced jointly by UNICEF, ACF-UK and the Coverage Monitoring Network.
To evaluate SAM management coverage, two distinct types of coverage are considered; geographical coverage2 and treatment coverage3. Geographical coverage aims to measure the availability of services for the treatment of SAM. The availability of services however does not equate with service access and uptake. In order to measure the accessibility and uptake of SAM management services, treatment coverage is used. SAM treatment coverage is defined as the proportion of children with SAM who receive therapeutic care. This information can be estimated either directly or indirectly. Direct coverage assessment methodologies to measure treatment coverage use a combination of qualitative and quantitative methodologies4.
Geographical coverage in 2012
- Results from the 2012 Global SAM Management Update indicate that in 2012, 81.7% of countries (49 of 60) were able to report geographical coverage estimates.
- Of these 49 countries, 22 (36.7%) countries reported geographical coverage of <25%, 8 (13.3%) countries reported geographical coverage 25-50%, 3 (5%) countries reported geographical coverage 50-75% and 16 (26.7%) countries reported coverage >75%.
Geographical coverage results by country are presented in Figure 1. The fact that the large majority of countries reported such data is a positive indication of improved reporting and understanding compared to 2011. Nevertheless, although a large majority of countries reported national level geographical coverage data, an improvement in reporting does not guarantee the representativeness and accuracy of such data.
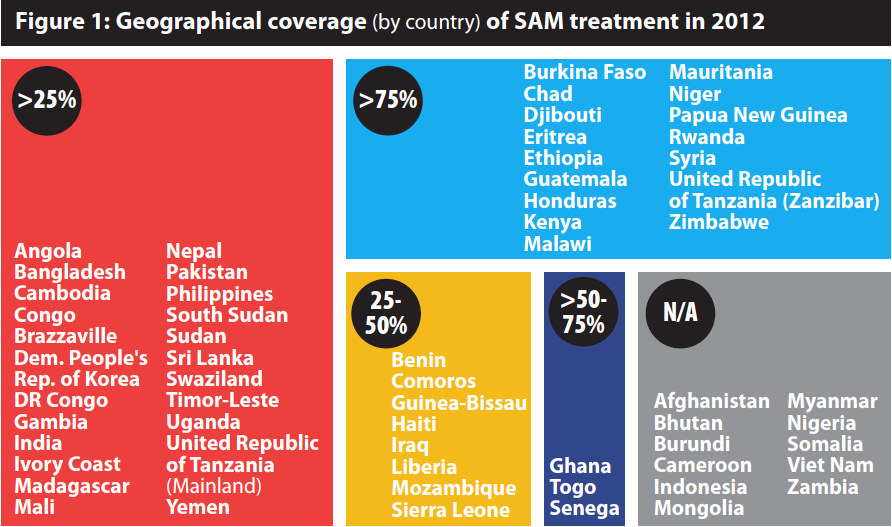
Source: UNICEF Global SAM Update Database
Firstly, national averages provide little information on sub-national variations, which in countries with uneven or localised distribution of SAM prevents a more in depth understanding of whether services are in the right location to meet needs. Secondly, defining geographical coverage based on health care facilities has limitations in terms of providing a deeper understanding of the catchment area of these facilities (i.e. spatial distribution, number of households/individuals per facility/quality of health services and physical proximity).
Treatment coverage in 2012:
- The 2012 Global SAM Management Update reported that 86.6% (52 of 60) of countries were able to report treatment coverage using indirect national estimates. The eight countries that did not report lacked SAM admission data.
- Of the 60 countries that reported nutrition data in 2012, 8 (13%) did not report treatment coverage, 28 (47%) reported coverage under 25%, 9 (15%) reported coverage 25-50%, 8 (13%) reported coverage 50-75% and 7 (12%) reported coverage over 75% (see Figure 2).
- It is important to note that only 14 countries out of the 60 in 2012 were aiming for countrywide scale up (75-100% SAM service provision); however, the results presented below are all national coverage estimates. Therefore for 38 countries where the programmes were not aiming to reach across the whole country, the national coverage rates do not accurately reflect the coverage of the programmes against their programme objectives, since the results are sub-national measured against a national burden denominator. This is important for contextualising the coverage rates achieved. Furthermore, the coverage percentages do not necessarily reflect the strong achievements of the programmes in terms of the high numbers of admissions treated (for many countries in the tens or hundreds of thousands), nor the progress made against the programmes’ targets, which are set in relation to the capacity in place and the funding available.
- The proportion of countries reporting treatment coverage <25% is high (47%). This is particularly important considering that treatment coverage derived indirectly produces (significant) overestimations. This means that the actual number of countries with treatment coverage <25% is likely to be higher.
- Many of these countries reporting <25% coverage are also ‘high burden countries’. The 28 countries reporting treatment coverage <25% contain almost 85% of the estimated global SAM burden.
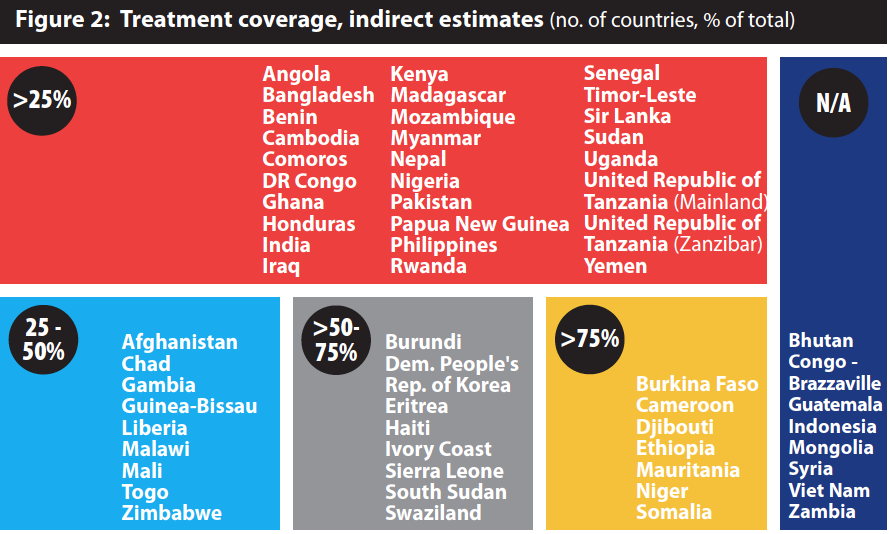
Source: UNICEF Global SAM Update Database
The representativeness of these indirect estimates are however problematic; indirect national estimates provide no information about the spatial distribution of coverage (high and low coverage areas) but instead offer an average estimate which may not be representative of any sub-national area.
Comparing indirect and direct treatment coverage
Discrepancies are evident between national level indirect estimates and sub-national direct estimates (provided by assessments compiled by the Coverage Monitoring Network) of treatment coverage. This suggests that indirect national estimates are overestimating the levels of treatment coverage which are being achieved. One of the challenges with the accuracy of indirect estimation lies with the calculation of the denominator (‘SAM burden’). This is due to: (1) often unavailable up-to-date census data to define the national under five population (2) Prevalence data not being based on seasonal changes and (3) the use of an average incidence correction factor. In addition, the global figures of cases admitted into SAM management services (the numerator) are derived from a range of information management systems which vary in quality and hence can be problematic.
In an effort to address some of the challenges from indirect methods, direct methods for estimating SAM coverage at the national and subnational level have been developed in recent years. Direct coverage surveys within the appropriate context provide a different lens to coverage estimation, being better suited to indicate coverage with more precision at a particular point in time than the indirect method. Nevertheless, there are also challenges around using these direct survey methodologies. Direct methods are commonly used at the sub-national level, but their use in estimating national SAM coverage remains limited. The limited use of direct estimations at a national level remains a significant barrier to gaining a reliable understanding of SAM coverage.
Assessing the bottlenecks
Availability of services (geographical coverage) does not equate with service access and uptake (treatment coverage). There are many other factors which positively and negatively influence uptake and success of SAM management. The data from sub-national coverage assessments compiled by the Coverage Monitoring Network provides some insight into barriers which influence attendance at SAM treatment services (Figure 3).
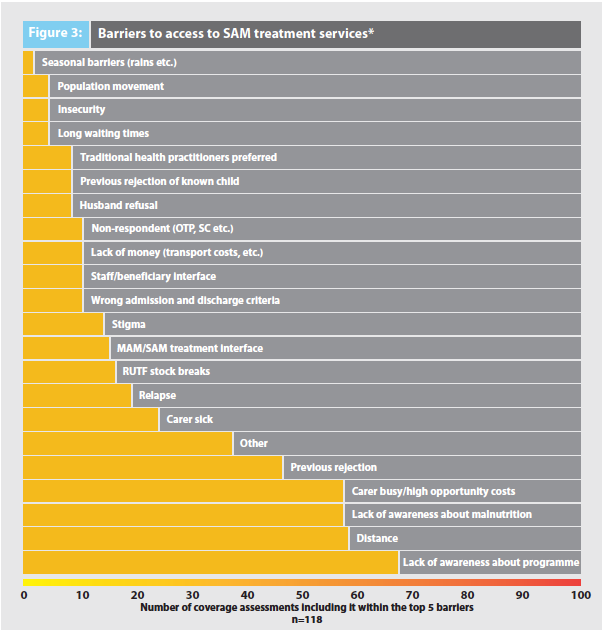
*Number of times mentioned, multiple assessments, 2003-2013
- Distance is a major barrier to access thereby affecting coverage. Geographical coverage does not imply equitable and widespread access.
- Awareness (of both the programme/services and of the need for clinical treatment) is another major barrier which is also linked to access. Community sensitisation and awareness raising is vital to ensure access and uptake of SAM treatment. Yet, the large catchment areas of health facilities combined with limited resources for these activities means that awareness about available services often remains limited.
- Availability and awareness can foster access, but both service uptake and compliance with treatment (low defaulting) are intrinsically linked to the opportunity costs associated with SAM treatment. Whilst the introduction of community based SAM treatment services has significantly decreased opportunity costs, there is a growing body of evidence that suggests that delivering optimal coverage requires further measures to reduce such costs.
Recommendations
Strengthen routine SAM management data. Enhanced availability and quality of nutrition information is essential for a better understanding of needs (the burden of SAM) and to strengthen programming.
Review and consolidate the definition of geographical coverage. Two main revisions to this definition used in annual reporting should be reviewed and consolidated. Firstly, the way healthcare facilities are classified must be reviewed. Secondly, the current (facility-based) definition should be reviewed and expanded to capture the level of availability and equity of access.
Improving estimates of treatment coverage. A twin track approach is required to continue to strengthen understanding and estimation of coverage. Improved routine data will enable more accurate estimations around programme coverage and quality. At the same time, efforts must be made to refine and strengthen, promote, finance and support the use of adequate methodologies for direct treatment coverage estimation. In the short term, there should be efforts to strengthen the evidence base. In the mid-term, a technical and operational framework for supporting national coverage surveys needs to be developed. In the long term, there should be efforts to integrate SAM coverage estimation into national nutrition/health assessments.
1Available at http://reliefweb.int/report/world/state-globalsam-management-coverage-2012
2SAM geographical coverage definition =Health care facilities delivering treatment for SAM / Total number of health care facilities
3SAM treatment coverage definition = Admissions / Burden = Population 6-59m x [Prevalence + (Prevalence x 1.6)]
4For other key definitions, see ‘UNICEF global SAM manage ment update (2012)’ news piece in this issue of Field Exchange (47).