
Effect of nutrition survey ‘cleaning criteria’ on estimates of malnutrition prevalence and disease burden: secondary data analysis
Summary of research1
Location: Global
What we know: Standardised methods for collection and reporting malnutrition prevalence data in nutrition surveys are used.
What this article adds: Methods for cleaning data are not standardised, vary and are rarely described in reports. A secondary analysis of 21 DHS datasets applying different cleaning criteria found a profound effect on the reported prevalence of both moderate and severe wasting. This varied by country and was most pronounced for severe wasting. Recommendations include mandatory reporting of cleaning criteria, urgent international consensus on optimal cleaning criteria and ‘real time’ validation of extreme variables made possible with electronic data collection.
Nutrition surveys, from which the all-important malnutrition prevalence statistics are derived, generally follow similar and standardised methodologies for the collection and reporting of data. However, ‘data cleaning criteria’ are rarely described in reports, yet are almost always applied to raw data. Their purpose is to exclude very high or low values which are more likely to represent measurement or data error than a truly very large or very small child. They are particularly useful when it is not possible to return to the field to review individual children directly. While there are many reasonable and justifiable ways to decide on the inclusion/exclusion of an individual child or individual measure of growth, there is no one gold standard which is applied in all settings and all situations. Even in the same context, there is every chance that different analysts may select different criteria. The effect of these different choices on the direction and magnitude of malnutrition estimates is currently unknown. A recent paper set out to quantify how different, commonly used data cleaning criteria affect nutrition survey wasting prevalence statistics.
Method
The researchers performed secondary analysis of 21 national demographic and health survey (DHS) datasets, each with anthropometric data collected using standard DHS methods. The datasets were chosen as they represent countries from the Lancet series with a high burden of disease. The total dataset has a reference population of 36 countries, which account for the majority of the global malnutrition disease burden. The 21 were those which had available nutrition surveys done in the last ten years. Each DHS survey size is large enough for robust national prevalence estimates. In total, the 21 DHS surveys comprised n = 216,841 children (after n = 38,136 records with missing age variables had been removed). DHS survey methods are well standardised, both within-country and between countries, with thorough data checking and processing procedures ensuring errors are a rarity.
Weight-for-age (WAZ), height-for-age (HAZ) and weight-for-height (WHZ) Z-scores based on WHO growth standards had previously been calculated from weight, height/length, age, and sex variables using Emergency Nutrition Assessment (ENA) software, developed for the Standardised Monitoring and Assessment of Relief and Transitions (SMART) initiative. Any records with missing WAZ, HAZ, or WHZ were removed (n = 13,545). The mean WAZ, HAZ, and WHZ for each country were then calculated for children aged 6–59 months using the appropriate DHS sample weights.
Extreme value cut-offs
Extreme anthropometric values are considered more likely to represent measurement or database errors than an individual who is truly very small or very large. The cut-offs for defining extreme values depend on the data cleaning method adopted, which may be based on the mean Z-score of either the reference population (‘fixed criteria’) or the observed data (‘flexible criteria’).The study compared five methods that are currently in widespread use (see Table 1), three of which are ‘fixed’ criteria and two ‘flexible. Note that the Z-score is defined by the standard deviation of the reference dataset rather than that of the sample in both the flexible and fixed methods.
The study authors note that the World Health Organisation (WHO) recommends their flexible criteria are adopted when the observed mean Z-score is below −1.5, otherwise they recommend use of fixed criteria. While none of the 21 DHS surveys studied in this work had a mean WHZ less than −1.5, the study applied both fixed and flexible criteria to allow for comparison. It should also be noted that criteria were applied in a manner that replicates their implementation in commonly used nutritional survey software when calculating the prevalence of wasting. Therefore, when using WHO and SMART criteria, outliers were only excluded using WHZ thresholds. However, when using EpiInfo criteria, WHZ, WAZ, and HAZ thresholds were used to identify outliers. When using EpiInfo criteria, exclusions were also made on the basis of biological implausibility criteria, i.e. incompatible combinations of HAZ and WHZ, HAZ > 3.09 and WHZ < −3.09, or HAZ< −3.09 and WHZ>3.09.
Table 1: Cleaning criteria: five methods currently in use for cleaning survey data prior to calculation of malnutrition prevalence |
|||||
Cleaning method |
Statistical probability criteria
|
Biological plausibility criteria
|
Reference mean |
||
|
WHO (2006) Growth standards (WHO, 2006b) |
HAZ < −6 HAZ > 6 |
WAZ < −6 WAZ > 5 |
WHZ < −5 WHZ > 5 |
- |
Growth Standards |
|
SMART flags* (SMART, 2013) |
HAZ < −3 HAZ > 3 |
WAZ < −3 WAZ > 3 |
WHZ < −3 WHZ > 3 |
- |
Survey Sample |
|
WHO 1995 Flexible criteria** (WHO, 1995) |
HAZ < −4 HAZ > 3 |
WAZ < −4 WAZ > 4 |
WHZ < −4 WHZ > 4 |
- |
Survey Sample |
|
WHO 1995 Fixed criteria (WHO, 1995) |
HAZ < −5 HAZ > 3 |
WAZ < −5 WAZ > 5 |
WHZ < −4 WHZ > 5 |
- |
Growth Reference |
|
Epi-Info (WHO, 2006a) |
HAZ < −6 HAZ > 6 |
WAZ < −6 WAZ > 6 |
WHZ < −4 WHZ > 6 |
HAZ > 3.09 and WHZ < −3.09 HAZ < −3.09 and WHZ > 3.09 |
Growth Reference |
HAZ, Height-for-age z-score; WAZ, Weight-for-age z-score; WHZ, Weight-for-height z-score.
* The upper and lower values are flexible, i.e., can be increased based on judgment (WHO, 2006b).
** Recommended for use when the observed mean z-score is below 1.5 (WHO, 1995).
Analysis
Analysis was performed using Stata version 12 (StataCorp., TX), using the appropriate sample weights defined by DHS. Wasting and severe wasting prevalence based on current case definitions were estimated for each country, excluding records according to each cleaning criteria in turn. The standard deviation of weight-for-height measurements, after the data were cleaned, was then calculated for each country. Country-level wasting prevalence was compared to the international ‘integrated food security phase classification’ (IPC), which is used to determine the severity of an emergency and guide the need for interventions (see Table 3). The IPC serves here to demonstrate the extent of differences between cleaning criteria. To illustrate the implications for treatment programmes, the study estimated the caseload over a one year period for severe wasting (WHZ < −3) for each of the cleaning criteria in turn, using the formula:
Caseload for severe acute malnutrition (SAM) = N ×P×K ×C where
N is the size of the population in the programme area
P is the estimated prevalence of SAM
K is a correction factor to account for new cases over the one year period
C is the expected mean programme coverage over the one year period.
Results
In the 21 surveys, there was a total sample size of 163,228 children aged 6 to 59 months. These were representative of a total estimated population of 211 million children. Samples varied relative to country size; India’s DHS survey had the largest sample (45,398 children) and Cote D’Ivoire the smallest (1,710 children).
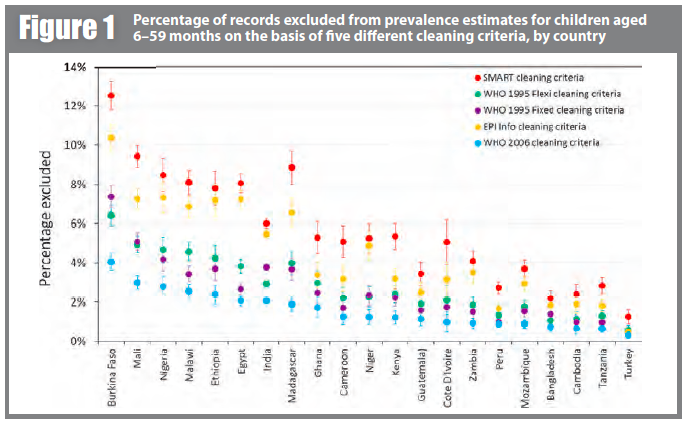
Figure 1 shows the percentage of records excluded from prevalence estimates on the basis of five different cleaning criteria, by country (for children aged 6–59 months). SMART criteria consistently exclude the most children and WHO-2006 criteria exclude the least. However, what difference this makes, in terms of the absolute and relative proportion of exclusions, varies markedly by country. In Burkina Faso, 4.1% were excluded by WHO-2006 and 12.5% were excluded by SMART, while in Turkey 0.3% were excluded by WHO-2006 and 1.3% by SMART.
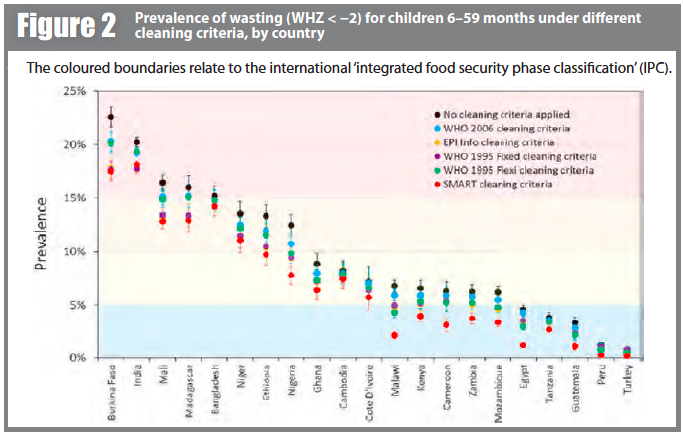
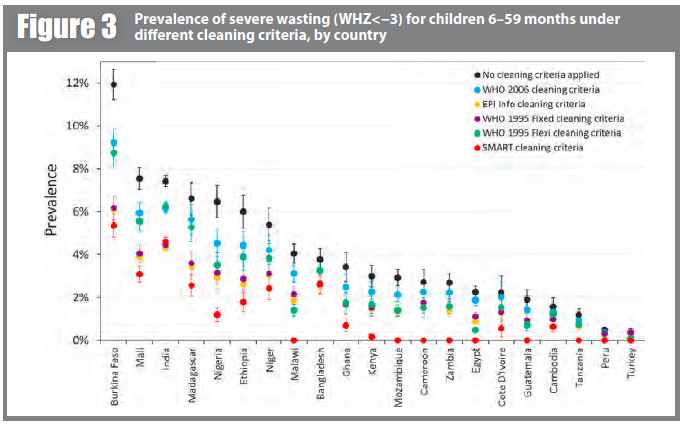
Prevalence estimates for wasting and severe wasting of children 6–59 months are shown under different cleaning criteria, by country, in Figures 2 and 3 respectively. In many countries, whilst the absolute prevalence figure varies according to cleaning criterion, the IPC category does not change. In other countries, the application of different cleaning criteria results in the crossing of a phase boundary and a different categorisation of ‘severity’. The proportional differences in severe wasting are greater than for total wasting.
Estimated clinical caseloads for SAM for every country under each cleaning criteria can be seen to vary greatly. For example, were no cleaning criteria applied for India, the country would have to plan for some 10.4 million SAM cases; with WHO-2006 criteria, for 8.7 million cases; and with SMART flags, for only 6.5 million cases. Large differences in estimated caseload are observed in many counties when the least inclusive cleaning criteria are compared with the most inclusive cleaning criteria. In nine countries, SMART flags exclude all potential cases of SAM.
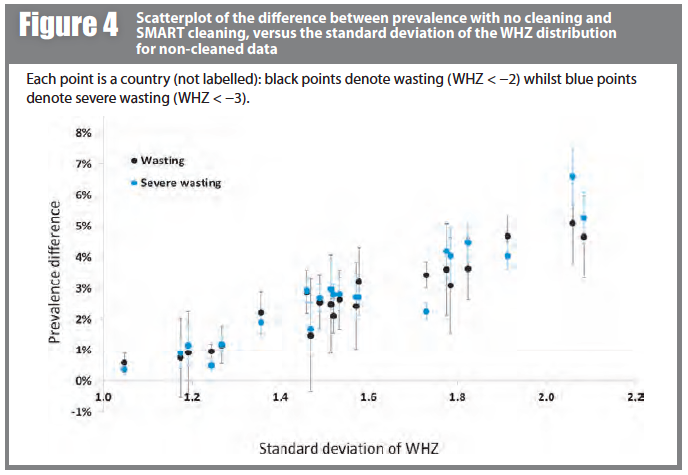
Figure 4 shows prevalence estimates under the (least inclusive) SMART criteria plotted against the standard deviation of the WHZ distribution before data exclusion. The observed linear relationship helps to explain the differences seen; the wider the survey distribution (due to either lower survey data quality or the heterogeneity of the population), the more likely the extremes are to be excluded, hence the greater the difference in prevalence estimate. It is also important to note here that there may be children with incorrect anthropometric measurements that are within the plausible range and so are not removed by the cleaning criteria.
Conclusions and discussion
The results show that the application of different cleaning criteria has a profound effect on the reported prevalence of both moderate and severe wasting. The magnitude of effect varies markedly between different countries, and is most pronounced for severe wasting. This in turn has a marked effect on estimated programme caseloads. Since wasting prevalence is a key statistic but choice of cleaning criteria is not currently standardised, differences in practice between individual analysts could unduly influence the results that are made available to decision-makers. This may potentially lead to inconsistent, inefficient and inappropriate implementation of malnutrition treatment programmes.
This is, to the authors’ knowledge, the first paper to highlight this important issue. However, the authors acknowledge study limitations. First, the results are based on a relatively limited number of countries and it is important that the analysis is extended elsewhere, particularly to different types of datasets. DHS follow a standardised methodology and are mostly done in relatively stable environments. Surveys conducted in emergency settings, working under greater pressure and sometimes by more inexperienced teams, may have more issues with data quality, so cleaning criteria may have even more effect on final results—but this would need to be confirmed. Second, in the caseload calculations for therapeutic feeding, it has not been possible to take into account the prevalence of oedematous malnutrition, nor that defined by low mid upper arm circumference (MUAC). These independent criteria for SAM also account for programme admissions and are not influenced by choice of cleaning criteria. So where, for example, the prevalence of oedematous malnutrition is high, the weight-for-height caseload estimates only form a small part of the estimate of global acute malnutrition (GAM); even if wasting caseload doubles, it may not make a large overall contribution to caseload planning.
Another limitation is that the study has focused on the impact of anthropometric cleaning criteria on wasting, and has ignored stunting and underweight. Future work, however, should explore the effect of data cleaning on other forms of anthropometrically defined malnutrition. In some situations, the application of cleaning criteria may well impact heavily on estimates of child overweight/obesity. Effects on stunting (low height-for-age) prevalence are also important to explore.
As well as inadvertent differences due to poor awareness of the effect of cleaning criteria, there is clearly also potential for deliberate “gaming”, by which inclusive or exclusive criteria are deliberately chosen to fit political agendas.
Fourth, it is important to extend the analysis to other age groups. This study has focused on children aged 6–59 months since they are the main target group for therapeutic and supplementary feeding programmes. However, malnutrition can also be prevalent in older children (and even in adults in extreme situations) and infants aged <6 months. Cleaning criteria may have different effects on prevalence estimates in these other groups.
The way forward
To address the problems raised in this study, the authors propose several solutions. The first is a call for mandatory reporting of which cleaning criteria were used so that results may be interpreted accordingly. Any inter-survey or time trend differences can thus be accounted for as potentially due to/not due to (if the same criteria are used consistently) data cleaning practices. Building on this work, it may be possible to establish equations by which prevalence calculated using one cleaning method could be “transformed” to an estimate using another method. This would, however, be at best an approximation and would only be needed if raw datasets were unavailable for full re-analysis (the current momentum to open-source datasets as well as results would be helpful here). A third call is for urgent international consensus and guidance on selecting and adopting a single set of optimal cleaning criteria. This would improve the comparability of nutrition survey data (including trend data in the same setting) and the coherence of associated policy recommendations.
Finally, and for the longer term, the authors note the current trend to electronic data collection. This may be particularly useful for nutrition surveys as extreme data values could potentially be validated in the field, reducing or eliminating the need for data exclusion during analysis. The study concludes by repeating a call for greater awareness of cleaning criteria as an explanation of inter-survey differences in malnutrition prevalence.
1Crowe S, Seal A, Grijalva-Eternod C, Kerac M. (2014). Effect of nutrition survey ‘cleaning criteria’ on estimates of malnutrition prevalence and disease burden: secondary data analysis. PeerJ2:e380 Full text available at: http://dx.doi.org/10.7717/peerj.380