
RAM-OP: A rapid assessment method for assessing the nutritional status, vulnerabilities, and needs of older people in emergency and development settings
Dr Pascale Fritsch is an experienced public health specialist. Since April 2011, she is Health and Nutrition Adviser with the HelpAge International Emergency Team, providing technical guidance and building evidence of the vulnerability of older people in humanitarian situations, in the health and nutrition sectors.
Mark Myatt is a consultant epidemiologist. His areas of expertise include surveillance of communicable diseases, epidemiology of communicable diseases, nutritional epidemiology, spatial epidemiology, and survey design. He is currently based in the UK.
Katja Siling is a survey consultant and epidemiologist with experience in applying qualitative and quantitative methods for data collection in Africa and Asia. She is currently based in Johannesburg, SA.
Location: Ethiopia
What we know: Older people are a neglected group in humanitarian responses. There is a need for a simple, cheap, and rapid tool to assess the nutrition and other needs of older people in humanitarian situations.
What this article adds: A prototype Rapid Assessment Method for Older People (RAM-OP) was compared with the SMART method in a pilot in an urban/peri-urban setting in Ethiopia. RAM-OP survey results were comparable to the SMART survey at about two-thirds of the cost. Suggested changes to the RAM-OP method will be piloted in subsequent field trials.
Introduction
Older people are a neglected group in humanitarian responses, even as their numbers grow as life-expectancy increases in much of the developed and developing world. This neglect is particularly obvious in the nutrition sector where the overwhelming majority of activities target children and / or women of childbearing age. Older people are vulnerable to malnutrition but their nutritional status and needs are very seldom assessed and almost never addressed. There is a need for a simple, cheap, and rapid tool to assess these (and other) needs and to enable humanitarian actors to advocate, plan, and deliver relevant and comprehensive responses for older people.
In January 2014, HelpAge International, Valid International, and Brixton Health funded by the Humanitarian Innovation Fund (HIF) began developing a novel method for assessing the nutritional and other needs of older people in emergency and development settings. The Rapid Assessment Method for Older People (RAM-OP) is intended to offer a simple, rapid, low cost, accurate, and reliable survey method for assessing the nutritional status, vulnerabilities, and needs of older people.
The RAM-OP method will use a two-stage spatial sample with a small (e.g. m = 16 clusters) and spatially even first-stage sample and a small (i.e. n < 200) overall sample. Modern computer-intensive data analysis procedures will be used. All of the computer-intensive data analysis procedures required will be performed by free and open-source data analysis software that is currently under development. Guidelines, articles, and training material will be produced. The focus of the work developing RAM-OP is on older people but elements of the work will also be applicable for assessing the nutritional status, dietary diversity, infant and young child feeding (IYCF) practices, food security and other indicators in other populations.
The first field trial of the RAM-OP method was undertaken in Kolfe Keranyio, a sub-city of Addis Ababa (Ethiopia) in February and March 2014. Testing involved performing two surveys using the SMART method and a prototype RAM-OP method simultaneously in the same population and comparing the two surveys in terms of resource requirements and survey results. This article describes key elements of the RAM-OP method and the results of the first field trial of the method. The field trial reported here is for an urban / peri-urban population. A second trial in a rural setting in sub-Saharan Africa is planned.
Survey setting
Kolfe Keranyio is a sub-city of Addis Abba with a population of about 430,000 persons according to the 2007 Ethiopian census. About 7.4% of the population of Kolfe Keranyio are aged fifty years and older. The sub-city hosts a mix of communities (i.e. from the very poor to the very affluent in both Muslim and Christian faith communities). Housing densities and types vary from dense urban and peri-urban shanties, suburban villa and apartment developments, and peri-urban smallholdings.
The sub-city is divided into administrative districts which were called “kebele” in 2007 but are now called “woreda”. These administrative districts are further divided into smaller contiguous and non-overlapping areas called “enumeration areas” (EAs). These EAs were used for the 2007 census and form the basis for budget allocation and service planning by national, city, and district governments.
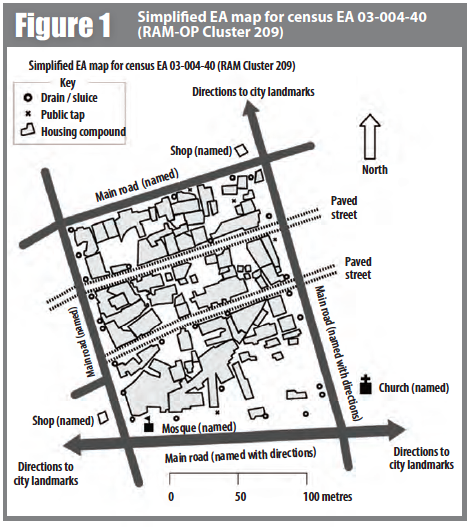
The current population size and the number of households in each EA were estimated from the 2007 census. Detailed large-scale maps of EAs were available. Figure 1 shows a simplified EA map. The availability of population data and usefully detailed maps led to us choosing census EAs as the primary sampling unit (PSU) for the RAM-OP and SMART surveys reported here.
Sampling
Sample sizes were calculated using standard formulae to achieve a 95% confidence interval of plus or minus two percentage points on a 5% estimate for global acute malnutrition (GAM) assuming a design effect of 1.5. The overall sample size required for the RAM-OP survey was n = 192. The overall sample size required for the SMART survey was n = 684. For RAM, m = 20 clusters of n = 12 older people; for SMART, m = 30 clusters of n = 23 older people. The difference in the required sample sizes was due to RAM-OP using a more efficient estimator for GAM than the estimator used by SMART (see Box 1 for details of the different approaches). The required sample size for the RAM-OP survey was increased to n = 240 for this field trial because this was the first use of the RAM-OP method (all previous experience with RAM type surveys had been in children aged between six and fifty-nine months and children aged between zero and twenty-three months) and the first use of RAM in an urban setting.
Box 1: Classic and PROBIT estimators of GAM prevalence
The estimate of GAM made from the SMART survey data used the classic estimator:

The estimate of GAM made from the RAM-OP survey data used a PROBIT estimator. This is a modelbased approach. The PROBIT function is also known as the inverse cumulative distribution function. This function converts parameters of the distribution of an indicator (e.g. the mean and standard deviation of a normally distributed variable) into cumulative percentiles. This means that it is possible to use the normal PROBIT function with estimates of the mean and standard deviation of indicator values in a survey sample to predict (or estimate) the proportion of the population falling below a given threshold. For example, for data with a mean MUAC of256 mm and a standard deviation of28 mm the output ofthe normal PROBIT function for a threshold of210 mm is 0.0502 meaning that 5.02% of the population are predicted (or estimated) to fall below the 210 mm threshold.
Both the classic and the PROBIT methods can be thought of as estimating area:
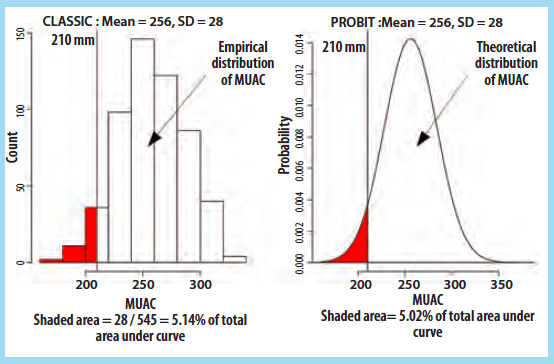
The principal advantage of the PROBIT approach is that the required sample size is usually smaller than that required to estimate prevalence with a given precision using the classic method.
The PROBIT method assumes that MUAC is a normally distributed variable. If this is not the case then the distribution of MUAC can be transformed towards normality. This was done with data from the RAM-OP survey reported here.
Both surveys used two-stage cluster sampling:
First stage samples
In first stage sampling for the SMART survey, 30 PSUs (EAs) were selected using population proportionate sampling (PPS) from a complete list of EAs in the survey area.
In first stage sampling for the RAM-OP survey, 20 PSUs (EAs) were selected systematically from a complete list of EAs in the survey area sorted by administrative district. This procedure, known as implicit stratification, should select a sample that is reasonably evenly distributed across the survey area. This also tends to spread the sample properly among important sub-groups of the population such as urban / peri-urban, administrative districts, ethnic / religious sub-populations, and socio-economic groups.
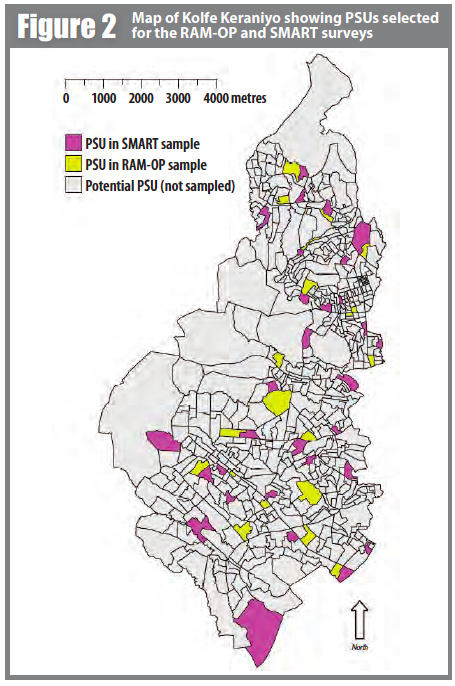
Figure 2 shows a map of Kolfe Keranyio with PSUs (EAs) selected for the SMART and the RAM-OP survey marked. Both samples are evenly distributed across the survey area. This is due to the reasonably uniform distribution of the populations of potential PSUs. In settings where potential PSUs had widely varying populations, the SMART sample would have been concentrated in the most populous PSUs (EAs).
Second stage samples
The second stage sample (i.e. for selection of the respondents in each sampled PSU) for both surveys was taken using systematic household sampling. The sampling intervals were calculated before the start of the surveys based on the average EA population size and the target sample size for each survey. Every second household was selected for the SMART survey. Every fourth household was selected for the RAM-OP survey.
The availability of detailed EA maps (see Figure 1) facilitated the location of PSUs and PSU boundaries.
The final sample size for the RAM-OP survey was n = 320. This is considerably (i.e. one-third) larger than was intended. The final sample size for the SMART survey was n = 569. This is somewhat smaller (i.e. by about one-sixth) than was intended. Over-sampling is a waste of resources. Under-sampling raises both ethical concerns and (potentially) political problems. Problems of over-sampling and under-sampling would not have occurred using a within-PSU quota sample (i.e. taking a fixed number of persons from each PSU). It is envisaged that future field trials of the RAM-OP method will use a within-PSU quota sample as is done in expanded programme on immunisation (EPI) surveys and was done in the original SMART methodology and 30 by 30 cluster method.
Positive feedback on the sampling methods used was provided by members of the SMART team via the online forum en-net (www.en-net.org).
Survey implementation
Permissions to carry out the surveys were obtained from all relevant national and local bodies. Woreda health departments provided local guides to assist in location of PSUs and to liaise with community leaders and other agency personnel (e.g. the police).
The four-day training for data collectors included training on the objectives of the surveys, the survey questionnaire, survey indicators, sampling methodology, field procedures, MUAC (mid upper arm circumference) measurement (with standardisation), and field testing.
Seven teams of two enumerators were recruited, three teams for RAM, four teams for SMART. The survey teams were supervised by HelpAge International’s Humanitarian Health and Nutrition Adviser (PF), assisted by two experienced epidemiologists from Brixton Health (MM) and Valid International (KS). The two surveys were completed in eight days. A total of n = 889 people aged between 50 and 102 years (self-reported) were sampled.
The main challenges in the field were related to logistics. Seven teams shared two vehicles and a lot of time was wasted waiting in traffic and dropping each team off at their designated PSU. In addition, the mobile phone network coverage was very poor and once the teams finished, it was often difficult for them to get in touch with drivers to be taken to another PSU. These issues delayed the survey and each team was able to complete, on average, only one PSU per day. If each team had their own vehicles or better communications had been available, then each team would have been able to sample two PSUs per day. This would have shortened the duration of both surveys by half. Also, the survey questionnaire was in English and wasn't translated into local languages. Translation and making sure that everyone understood the meaning of the questions was extensively practiced during the training, however it is evident from results that there were some issues and inconsistencies in the way questions were translated by different enumerators. For the next pilot, the questionnaires will be translated into the local language in order to ensure data quality and consistency.
Data entry and checking
The data for both surveys were entered into identically structured EpiData v3.10 databases by dedicated data-entry staff. Interactive checks for range and legal values were applied. All data were double-entered and validated (verified) using a record-by-record and variable-by-variable comparison. Errors and discrepancies were resolved by consulting data-collection forms. Any errors that could not be resolved resulted in obviously or potentially erroneous values being censored (i.e. set to missing).
Data management
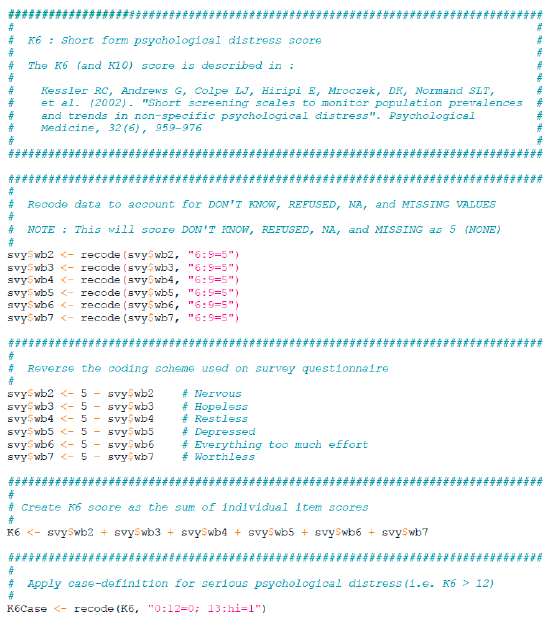
Data management consisted of creating indicators from the collected survey data. This was done for both the SMART and RAM-OP data using the same purpose-written scripts. Scripts were written using the R Language for Data Analysis and Graphics and managed using the R-AnalyticFlow scientific workflow system. This approach allowed for modular development of data-management and data-analysis code and provided tools for the documentation, testing, and debugging of scripts. Box 2, for example, shows the contents of a workflow node that was used to calculate the K6 (Kessler six item psychological distress score) indicator [K6].
Box 2: Example of indicator creation script (K6 short form psychological distress score)
Data related to survey costs were collected and entered into an OpenOffice Calc spreadsheet.
Data analysis
Analysis of survey data consisted of estimating proportions and means for a variety of indicators. The SMART survey data were analysed using the Taylor Linearised Deviation approach, as implemented in the CSAMPLE module of EpiInfo, to calculate confidence intervals for proportions and means [TLD]. The RAM-OP survey data were analysed using a blocked weighted bootstrap estimator:
Blocked: The block corresponds to the primary sampling unit (PSU) or cluster.
Weighted: The RAM-OP sampling procedure does not use population proportional sampling to weight the sample prior to data collection as is done with SMART type surveys. This means that a posterior weighting procedure is required. We used a “roulette wheel” algorithm (see Figure 3) to weight (i.e. by population) the selection probability of PSUs in bootstrap replicates.
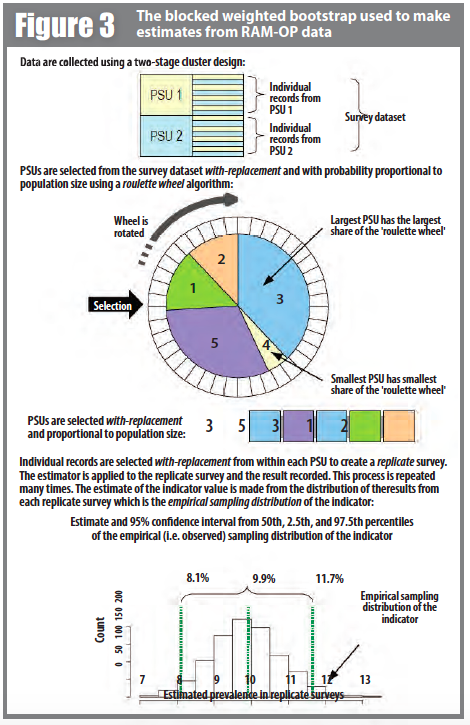
A total of m PSUs are sampled with-replacement from the survey dataset where m is the number of PSUs in the survey sample. Individual records within each PSU are then sampled with-replacement. A total of n records are sampled with-replacement from each of the selected PSUs where n is the number of individual records in a selected PSU. The resulting collection of records replicates the original survey in terms of both sample design and sample size. A large number of replicate surveys are taken (the work reported here used r = 3999 replicate surveys). The required statistic (e.g. the mean of an indicator value) is applied to each replicate survey. The reported estimate consists of the 50th (point estimate), 2.5th (lower 95% confidence limit), and the 97.5th (upper 95% confidence limit) percentiles of the distribution of the statistic across all replicate surveys. The bootstrap procedure is outlined in Figure 3. The bootstrap approach is computer-intensive but allows estimation of the sampling distribution of almost any statistic using only simple computational methods.
Comparisons between the results from the SMART and RAM-OP surveys were performed using the two-sample z-test. 95% confidence intervals on the difference between indicator levels estimated from the SMART and RAM-OP surveys were also calculated. See Box 3 for details of the methods used.
Box 3: Methods used for between survey comparisons of estimates of indicator levels

Data related to survey costs were analysed using an OpenOffice Calc spreadsheet.

Results
Table 1 shows the estimates of indicator levels from each survey and between survey comparisons for a selection of indicators for which data were collected. The indicators shown in Table 1 were selected as examples of:
- Means of a single continuous variable (i.e. age, MUAC).
- Means of a single discrete variable (i.e. household size, meal frequency from 24 hour recall).
- Means of multi-variable discrete scales or scores (i.e. dietary diversity from 24 hour recall, K6 psychological distress scale).
- Proportions for indicators calculated from a single variable (i.e. lives alone, has a source of income).
- Proportions for indicators calculated from multiple variables (i.e. consumes one or more foods rich in vitamin A, previously screened using MUAC or for bilateral pitting oedema).

* Type of indicator : C1 for the mean of single continuous variable, D1 for the mean of a single discrete variable, D2 for the mean of a multi-variable discrete scale or score, P1 for a proportion calculated from a single variable, P2 for a proportion calculated from multiple variables, MIX for mixed methods (see text).
** Two-sample z-test (see Box 3 for details of calculations of the z-test, 95% CIs, and the corrected p-value).
*** These results are presented as proportions (multiply by 100 to convert these results to percentages).
**** Results are for a classic estimator (SMART) and a PROBIT estimator (RAM-OP). See Box 1.
The final row of Table 1 shows the results for global acute malnutrition (GAM) based on the case definition MUAC < 210 mm. The estimated prevalence was 4.39% for SMART and 2.09% for RAM-OP. The SMART result is calculated using a classic prevalence estimator. The RAM-OP result is calculated using a PROBIT estimator. See Box 1 for details of these two approaches. Estimates from the SMART and RAM-OP surveys were not significantly different from each other. It is likely, however, that the observed difference would have been smaller had we used longer MUAC straps. We used MUAC straps that could not measure MUACs above 350 mm. All MUAC measurements above 350 mm were treated as MUAC = 350 mm. This occurred for approximately 6% of respondents. The likely effect of this truncation of higher MUAC values would be to have created a small negative bias in the PROBIT estimate of GAM. The next RAM-OP pilot will use MUAC straps capable of measuring MUACs up to about 500 mm.
All estimates of indicator levels made from the RAM-OP survey data were made with useful precision. The next RAM-OP pilot will reduce the RAM-OP sample size to n = 192 collected from m = 16 PSUs taking a fixed size (quota) sample from each PSU.
All of the comparisons presented in Table 1 were not significant at either the p < 0.05 or the corrected p < 0.0009 levels (see Box 3). This was not the case for thirteen of the sixty calculated indicators. All of these thirteen indicators were based on non-validated question sets. For example, low vision and blindness (significant at p = 0.0105) was assessed by self-report rather than by a formal assessment of visual acuity. No significant differences were found between the surveys for any indicator calculated in a standard manner from data collected using standardised questions-sets or from purely quantitative measurements. The next RAM-OP pilot will use tested and standardised techniques for all indicators.
Table 2 shows the costs for the SMART and RAM-OP surveys reported here. The RAM-OP survey was cheaper than the SMART survey in proportion to the number of clusters sampled. In the work reported here, the RAM-OP survey cost about two thirds that of a broadly equivalent SMART survey. It is hoped that the number of PSUs could be reduced further (i.e. from m = 20 to m = 16 PSUs) which should reduce the costs of a RAM-OP survey to about half that of an equivalent SMART survey. The use of smaller within-PSU samples may bring further savings by allowing data to be collected from more PSUs per day.

*Negative values indicate that RAM-OP was less expensive then SMART, zero value indicate no difference in cost between RAM-OP and SMART, positive values (not present in this study) indicate RAM-OP was more expensive than SMART.

Conclusions
The field trial reported here suggested changes to the RAM-OP method which will be piloted in subsequent field trials. These include:
- Taking a fixed size (quota) sample from each PSU.
- Further use of standardised question sets and measure methods.
- Strict forward and backward translation of survey instruments and other survey documents.
- Better logistics and communications.
- Use of MUAC tapes capable of measuring MUACs up to 500 mm.
We will also test a wider range of food-security indicators and make better use of data collected for the purposes of assessing dietary diversity.
In the field trials reported here the RAM-OP survey provided comparable results to the SMART survey at about two-thirds of the cost of the SMART survey. Larger (i.e. up to 50%) cost savings may be possible. We will test whether savings of this magnitude can be made in subsequent field trials of the RAM-OP method.
For more information, contact: Mark Myatt, email: mark[at]brixtonhealth.com
The authors will be available to answer questions and provide support on using RAM-OP [the single coverage estimator] on the Assessment [Coverage assessment] forum on EN-NET, http://www.en-net.org.