How many lives do our CMAM programmes save? A sampling-based approach to estimating the number of deaths averted by the Nigerian CMAM programme
 By Assaye Bulti (UNICEF), Stanley Chitekwe (UNICEF), Chloe Puett (ACF), and Mark Myatt (Brixton Health)
 Assaye Bulti is responsible for managing routine nutrition programme data and nutrition surveys for UNICEF Nigeria. He holds an MSc in Epidemiology from London School of Hygiene and Tropical Medicine (LSHTM) and has a public health background. His areas of expertise include survey design, coordination of surveys, data analysis and management of programme data.
 Stanley Chitekwe is the Chief of Nutrition for UNICEF Nigeria. He has worked for ten years leading the national scaling-up of CMAM services in Nigeria and Malawi. He has worked with UNICEF for the past fifteen years. His training background is in epidemiology, human nutrition and biochemistry.
 Chloe Puett leads the cost-effectiveness research project at Action Against Hunger (ACF International). She holds a PhD in Food Policy and Applied Nutrition from Tufts University. Her areas of expertise include cost analysis and intervention research, particularly around community access to and utilisation of services.
 Mark Myatt is a consultant epidemiologist. His areas of expertise include surveillance of communicable diseases, epidemiology of communicable diseases, nutritional epidemiology, spatial epidemiology and survey design. He is currently based in the UK.
This article is accompanied by two postscripts; Andre Briend comments on how this article contributes to the evidence around cost-effectiveness of CMAM, whilst Max Bachmann was invited to explain the statistical methods. In the process of review, informal feedback provided by Max was shared with the authors who subsequently elaborated on content (most notably, the addition of sensitivity analysis and an expanded discussion section). The Field Exchange editors and articles authors extend thanks to the reviewers for their valuable contributions (Eds).
Introduction
Since the inception of the community-based management of acute malnutrition (CMAM) programme in Nigeria in September 2009 until October 2014, a total of 919,876 children with severe acute malnutrition (SAM) have been treated by the programme across eleven states (Adamawa, Bauchi, Borno, Gombe, Jigawa, Kano, Katsina, Kebbi, Sokoto, Yobe, and Zamfara) in northern Nigeria.
The CMAM programme is a child survival programme. However, the number of lives saved by the Nigerian CMAM programme is not yet documented. This is a common and persistent problem with nutrition interventions that dates back to the time of limited impact and limited coverage inpatient therapeutic feeding programmes. Health impact assessment statistics such as the number of deaths averted (lives saved) as well as cost-effectiveness statistics such as cost per death averted (cost per life saved), and cost per disability adjusted life year (DALY) averted are increasingly being used by governments and donor organisations to decide funding priorities. Their absence for common nutrition interventions may, therefore, jeopardise funding.
This article describes a simple and practicable method that has been used to estimate the number of lives saved by the Nigerian CMAM programme with the intention that this estimate be used as an advocacy tool to attract more government and international resources to the programme. The method described in this article was developed by UNICEF Nigeria and Brixton Health from previous work undertaken by Tufts University, the World Bank, the International Food Policy Research Institute and Brixton Health investigating the cost-effectiveness of different types of therapeutic feeding programme[1].
The method described in this article can be performed using readily available data (i.e. routine programme monitoring data, data such as mid upper arm circumference (MUAC) at admission that is commonly collected in SQUEAC coverage assessments, and programme accounting summaries). This means that the described method provides every CMAM programme with the ability to produce key health impact assessment statistics.
A counterfactual for estimating the number of deaths averted by a CMAM programme
Estimating the number of deaths averted by an intervention requires the construction of a counterfactual (i.e. an informed guess at what may have happened if the intervention had not happened). In the case of the number of deaths averted by a CMAM programme, the counterfactual is informed by the number of SAM cases treated by the programme (NT), the proportion of treated SAM cases cured by the programme (PC), and the expected excess mortality (EM) in untreated SAM cases with similar severity of wasting as those treated by the programme. If these are known or can be estimated, then the number of deaths averted can be calculated:

We know that 919,876 SAM cases were treated by the Nigerian CMAM programme between September 2009 and October 2014:

We estimated the proportion cured (PC) using data from:
1.A recently completed retrospective cohort study investigating outcomes in the 102,245 SAM cases admitted to the CMAM programme in Katsina and Jigawa states between January 2010 and December 2013. The proportion of programme beneficiaries discharged as cured in this study was 70.9%. We used this data to represent programme performance for the entire programme over the fifty-two months from September 2009 to December 2013.
2.Routine programme monitoring statistics for the entire programme for January 2014 to the end of October 2014 for 229,520 programme exits. The proportion of programme beneficiaries discharged as cured in this data was 83.3%. We used this data to represent programme performance over the ten months from January 2014 to October 2014.
A weighted (i.e. by time in months) average of these data is:

This figure is, however, likely to underestimate the true proportion of beneficiaries that benefited substantially from the programme. This is because it is likely that a significant proportion of defaulting cases will have “defaulted” because the child had recovered and was clinically well. Such cases might be considered as self-discharged as cured.
The proportion of programme beneficiaries who defaulted in the retrospective cohort study was 19.7%. The proportion of programme beneficiaries who defaulted in the routine programme monitoring data for the first ten months of 2014 was 13.3%. A weighted (i.e. by time in months) average of these data is:

Many of the cases that defaulted in the cohort study did so early in the treatment episode (i.e. more than 50% of cases defaulted after a single visit). It is unlikely, therefore that more than about 20% of defaulters could reasonably be considered to have been self-discharged as cured. It is also unlikely that none of the defaulters received a substantial benefit from attending the programme. It is likely, therefore, that the proportion self-discharged as cured lies somewhere between about 5% and 20% of all defaulters. There was no compelling reason to believe that any value between 5% and 20% is more likely than any other so the average of 5% and 20% (i.e. 12.5%) was used.
We estimated the proportion cured (PC) accounting for those self-discharged as cured to be about:

The expected excess mortality (EM) can be estimated from background mortality and expected mortality (i.e. the case fatality rate) in untreated SAM cases:

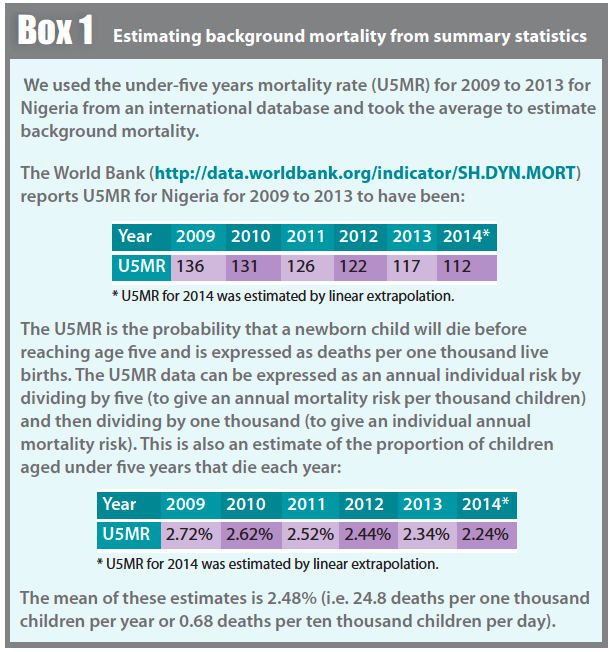
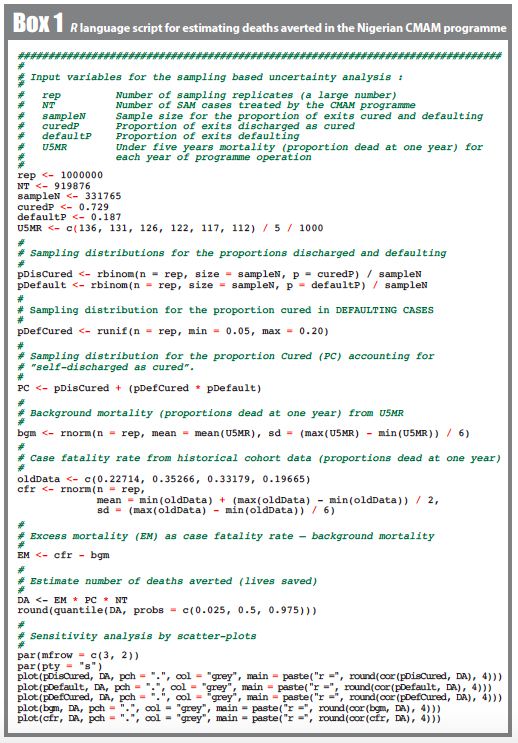
We used the under-five years mortality rate (U5MR) for 2009 to 2013 for Nigeria from an international database and took the average to estimate background mortality as 24.8 deaths per one thousand children per year (see Box 1).
Mortality (i.e. the case fatality rate) in both treated and untreated SAM cases varies with the severity of wasting. Mortality risk increases with increasing severity of wasting. Data on mortality risk in untreated SAM cases is available only from historical cohort studies. Since the advent of therapeutic feeding programmes capable of simultaneously delivering effective treatment (i.e. the current therapeutic feeding protocols and products) to large numbers of SAM cases (i.e. CTC1/CMAM programmes) earlier this century, leaving SAM cases untreated and waiting for them to recover or die is no longer an ethically defensible option. This means that we are restricted to working with historical data.
The Nigerian CMAM programme uses only MUAC and oedema for deciding admission. About 95.1% of admissions in the retrospective cohort study were admitted using MUAC with the remainder admitted using MUAC and oedema (1.4%), oedema alone (0.2%), or discretionary criteria such as visible severe wasting (3.3%). The very high proportion of admissions made using MUAC means that we were able to use mortality estimates for MUAC cases to estimate expected mortality in untreated SAM cases.
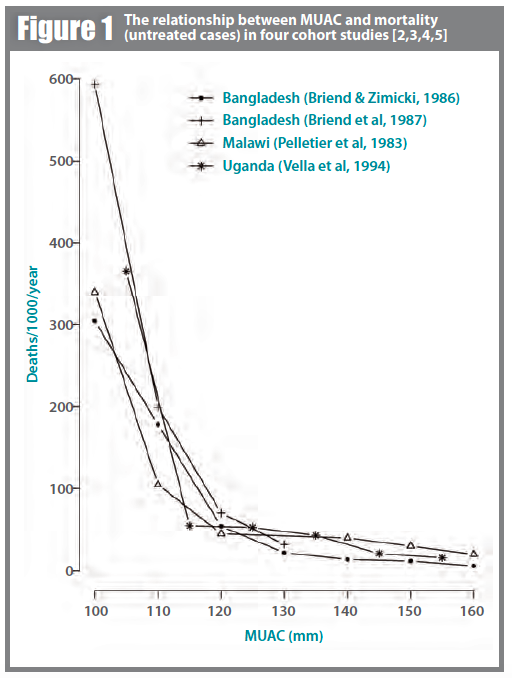
Figure 1 shows the relationship between MUAC and mortality, expressed in deaths per one thousand child-years, reported by four separate historical cohort studies [2,3,4,5]. Mortality increases exponentially with declining MUAC. There is little between-study variation in the observed relationships between MUAC and mortality despite the fact that these studies were undertaken by different teams in different locations at different times with varying lengths of follow-up and inconsistent censoring of accidental and violent deaths. This suggests that each study is estimating the same underlying rate and that the observed differences were due to varying lengths of follow-up, inconsistent censoring of accidental and violent deaths, measurement error and sampling error.
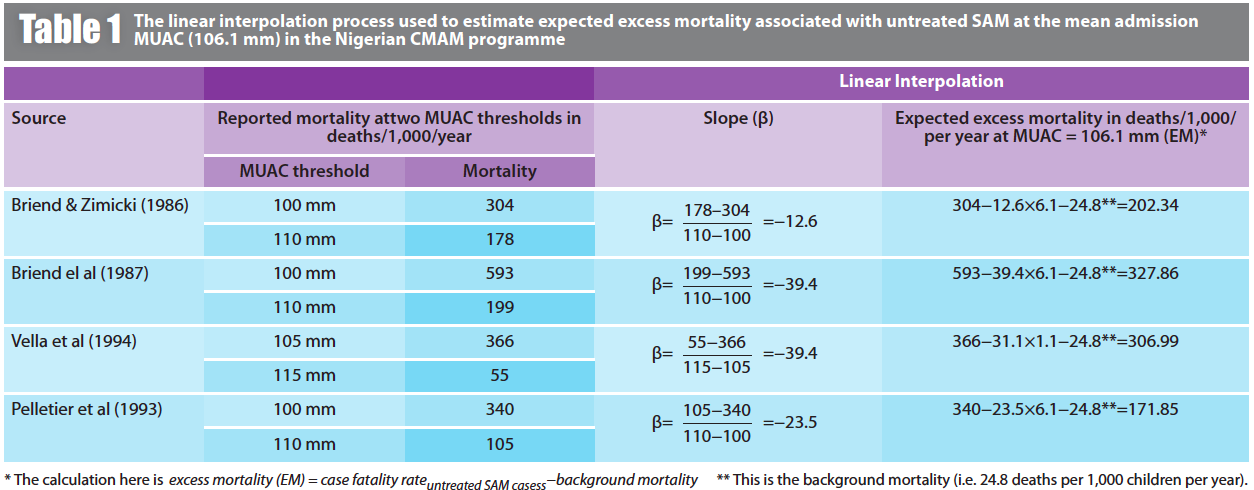
The estimate of mortality associated with MUAC used in the analysis reported here was calculated using the published data on mortality associated with MUAC in untreated SAM cases summarised in Figure 1 [2,3,4,5]. . Linear interpolation was used to estimate expected excess mortality at the mean admission MUAC (106.1 mm) observed in the cohort study (this data is also collected in SQUEAC coverage assessments). The reported mortality rates were corrected to allow for a background mortality rate of 24.8 deaths per one thousand children per year (see Box 1). The correction is made by subtracting background mortality from the estimated case fatality rate:

The linear interpolation and correction process is illustrated in Table 1.
It was assumed that the four mortality estimates in Table 1 were estimating the same underlying rate and that the observed differences were due to varying lengths of follow-up time, inconsistent censoring of accidental and violent deaths, measurement error, sampling error, errors introduced by our use of simple linear interpolation and propagation of rounding errors. Under this assumption, an average of the four estimates is likely to be more accurate than any single estimate.
A useful way of finding an average when you have very few data points is:

The resulting estimated excess mortality rate from the mortality data presented in Table 1 is:

This is the equivalent of 24.986% (i.e. about one quarter) of untreated SAM cases with the same mean MUAC (i.e. 106.1 mm) as cases admitted to the programme dying each year.
An objection that is occasionally raised against the use of historical cohorts of untreated SAM cases to estimate excess mortality in this way is that there is considerable evidence of significant drops in childhood mortality over the years since the cohort studies were done [6]. Such drops can be seen in Box 1 where the U5MR drops by almost 20% over five years. The objection is mistaken because the drops in childhood mortality are, in very large part, due to a combination of reductions in the incidence of the causes of childhood mortality, improvements in treatment coverage and improvements in treatment efficacy. In our counterfactual, we use the SAM cases admitted to the Nigerian CMAM programme and model what would happen to these cases if the programme had not existed. These cases already have the disease so reductions in incidence are not relevant. These cases are, in the counterfactual, untreated so improvements in treatment coverage and treatment efficacy are also not relevant. The SAM cases in the counterfactual have the same disease and the same absence of treatment as the SAM cases in the historical cohorts. In the absence of additional and contradictory evidence on the case-fatality rates for untreated SAM at different levels of severity (which would now be unethical to collect), there is no good reason to believe that the SAM cases in the counterfactual will not experience similar case-fatality rates to the SAM cases in the historical cohorts.
Having found/estimated the number treated (NT), the proportion cured (PC), and the expected excess mortality (EM) we estimated the number of deaths averted by the CMAM programme:

It is important to note that EM and PC are expressed in the same way (i.e. as proportions).
The problem with the estimate of deaths averted calculated above is that it is only a point estimate. A credible range of values that accounts for the uncertainty in estimates of programme cure-rates (PC) and the expected excess mortality rate (EM) would be more useful and more credible.
Accounting for uncertainty – A sampling-based approach
Uncertainty can be incorporated into the calculation of deaths averted by the CMAM programme using fuzzy numbers. A fuzzy number is a generalization of a “regular” real number in the sense that it does not refer to a single value but rather to a connected set of possible values where each possible value has its own weight (or membership function). The membership function typically ranges between zero and one. This range of weights has been found to be useful in many applications and when membership is defined on a semi-quantitative basis. Much of the data used in the calculation of deaths averted is taken from samples. This allows us to use sampling distributions (probability distributions) to define fuzzy numbers.
For example, the proportion discharged as cured (i.e. 72.9%) was estimated from a retrospective cohort study with a sample of size n = 102,245 and routine programme monitoring data for 229,520 programme exits. The total sample size for this estimate is:

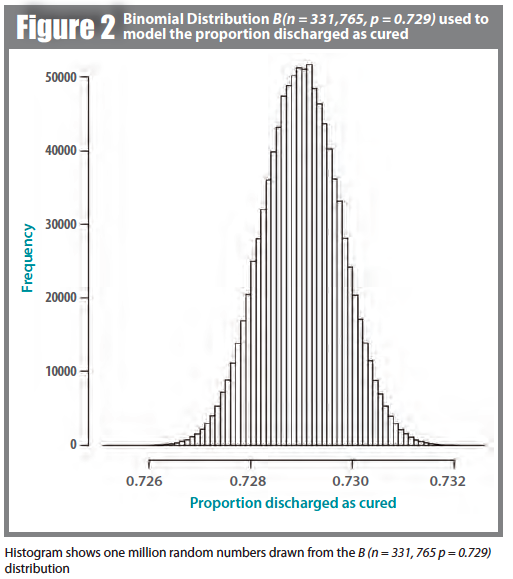
The proportion discharged as cured is a binomial proportion and can be modelled using the binomial distribution:

This particular distribution is shown in Figure 2. This is the theoretical sampling distribution of the proportion discharged as cured. The shape of the plot in Figure 2 reflects the level of belief about the true value of the proportion cured (i.e. we have most belief that it is close to the point estimate and little belief that it could be very far from the point estimate). In this case degrees of belief are determined by the statistical properties (i.e. the point estimate and sample size) of a sample.
In other cases the probability distribution used reflects informed guesses or reasoned belief alone. This is the case (e.g) with the proportion self-discharged as cured (i.e. defaulters who were cured before they defaulted). In such cases a probability distribution is chosen on a semi-quantitative basis. Given the distribution of lengths of stay in the programme for different outcomes we decided that it is likely that the proportion self-discharged as cured lay somewhere between 5% and 20% of defaulters. There was no compelling reason to believe that any value between 5% and 20% is more likely than any other so the continuous uniform distribution U(0.05, 0.20) was used. If we multiply the proportion defaulting by this distribution we get a second uniform distribution:

This approach neglects uncertainty in the proportion defaulting. We can model this using the binomial distribution:

The fuzzy number for the proportion self-discharged as cured that captures both sources of uncertainty is:

The fuzzy number for the proportion cured (PC) that captures all sources of uncertainty is:

This is shown graphically in Figure 3.
The approach of using sampling or probability distributions to define fuzzy numbers using a network of probability distributions is known as sampling-based uncertainty analysis [1].

A fuzzy counterfactual
Table 2 shows the probability distributions that we used to estimate the number of deaths averted by the CMAM programme.
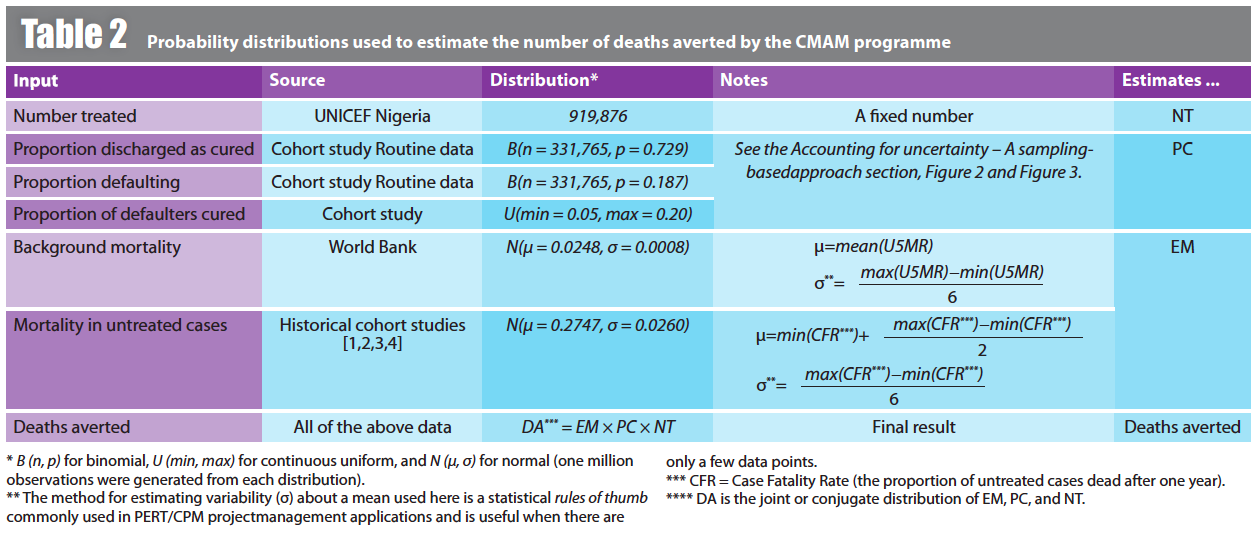
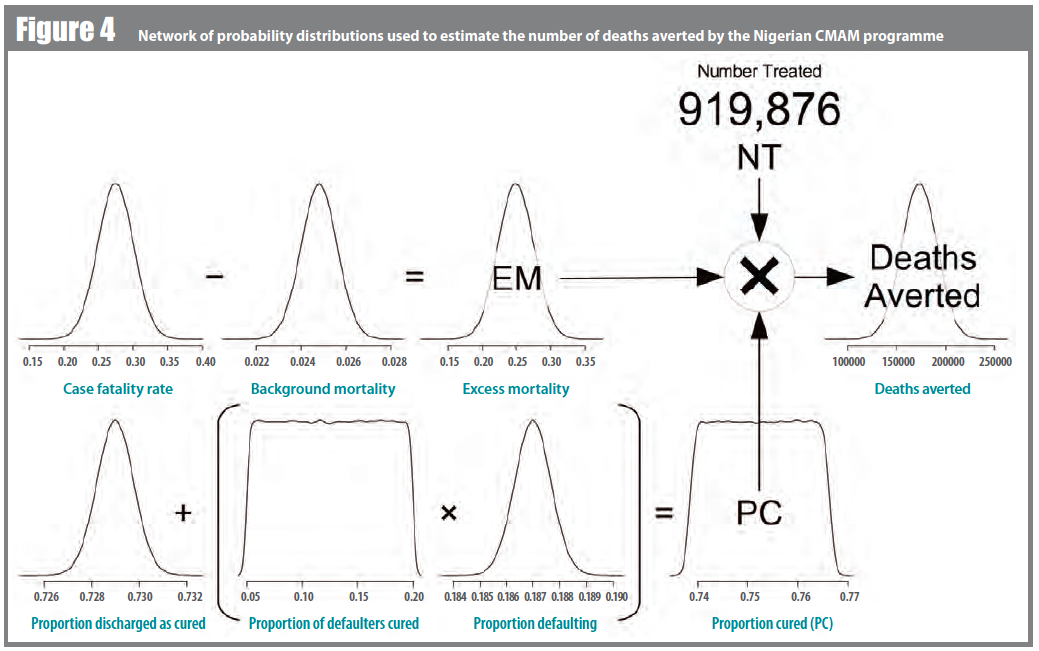
This network of probability distributions is shown graphically in Figure 4.
Each of the distributions in the network was generated using appropriate pseudo-random number generators. In the analysis presented here, each distribution consisted of one million pseudo-random numbers. All calculations were performed using the R Language for Data Analysis and Graphics. The R language script for the sampling-based uncertainty analysis used to estimate the number of deaths averted by the Nigerian CMAM programme is shown in Box 1.
Since the output of the network of probability distributions is also a probability distribution, we can produce a point estimate (i.e. the 50% percentile of the output distribution) and a 95% credible interval (i.e. the 2.5th and 97.5th percentiles of the output distribution). In the analysis presented here, the estimate of the number of deaths averted by the Nigerian CMAM programme is estimated to be 172,898 (95% CI = 137,526; 208,434).
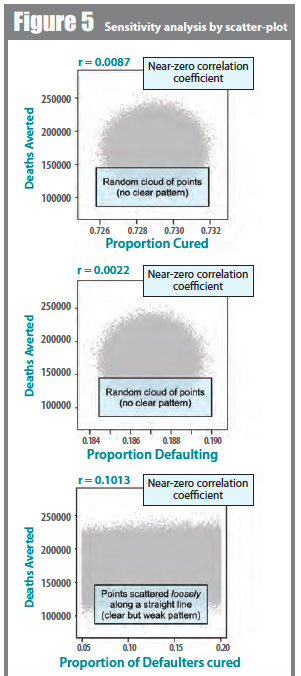
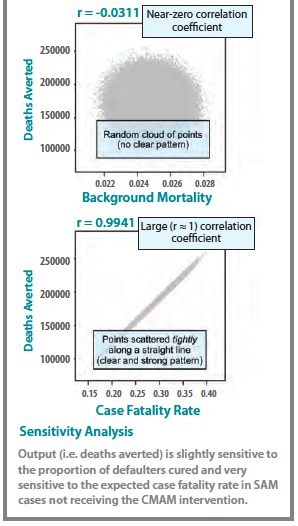
This type of analysis is usually accompanied by a sensitivity analysis. A sensitivity analysis explores how sensitive an output variable is to each of the input variables that are used to derive the output. A simple but useful way of performing a sensitivity analysis for a sampling-based uncertainty analysis is to produce scatter-plots of the output variable against each of the input variables. Each scatter-plot gives a direct visual indication of the sensitivity of the output variable to a single input variable. A strong pattern in the scatter-plot indicates sensitivity to a given input variable. Quantitative measures (e.g. correlation coefficients) may also be calculated. A large absolute value of a correlation coefficient indicates sensitivity to a given input variable. The R language script in Box 1 also performs this type of sensitivity analysis. In this study, the output (i.e. deaths averted) is slightly sensitive to the proportion of defaulters cured and very sensitive to the expected case fatality rate in SAM cases not receiving the CMAM intervention (see Figure 5).
Additional analysis
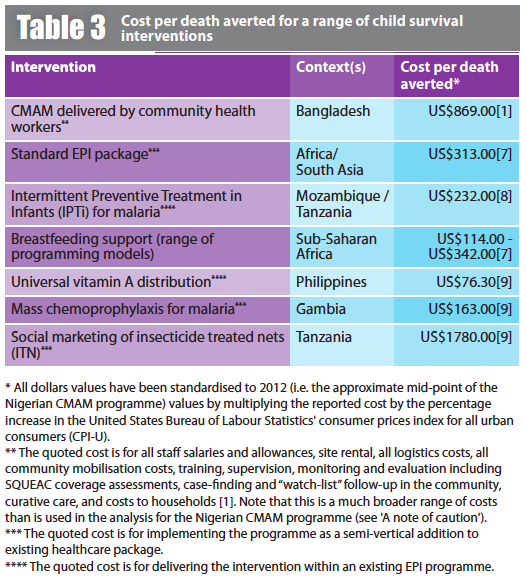
Having estimated the number of deaths averted it is possible, with little extra data, to estimate the cost per death averted (or cost per life saved). The total cost of the programme over the five years it had been running (which is also our assessment period) was US$47,416,818. The estimate of the cost per death averted is:

For comparison, Table 3 shows the cost per death averted reported for a variety of child survival interventions.
With a little extra data (e.g. the duration of an untreated episode of SAM, average age of SAM cases, sex-ratio of SAM cases, sex-specific life-expectancies at birth, disability weighting for SAM, and a reasonable and widely accepted discounting / age-weighting function), it is also possible to estimate the number of disability adjusted life years (DALYs) averted and cost per DALY averted [1].
 A note of caution
It is important with any calculation to consider the term garbage in - garbage out. If the data we use to inform our calculations is wrong or of poor quality (i.e. garbage in), then the resulting estimates will also be wrong or of poor quality (i.e. garbage out). It is important, therefore, to consider the quality, completeness, and trustworthiness of the input data that we use:
Routine programme monitoring data: Monitoring data is often not well recorded. A common problem is that the proportion cured is overestimated. In the work reported here, we used data from beneficiary record cards and applied data cleaning and decision rules to the data. This corrected a tendency for defaulters to be recorded as discharged as cured at some CMAM sites. We did use routine programme monitoring data to cover the ten months programme operation not covered by the retrospective cohort study. The proportion cured in the routine programme data was higher than that observed in the retrospective cohort study but this was consistent with an upward trend observed on the retrospective cohort data and with recent reforms to programme activities and siting aimed at reducing default rates. If you use routine programme monitoring data, then you should check the quality of (at least) a subset of data (e.g. using SQUEAC tools) and correct estimates of the proportion cured and the proportion defaulted accordingly. Checking may be difficult to do in settings of remote management or conflict. If checking cannot be done, then you could use the SPHERE minimum standard (e.g. 75%) for the proportion cured.
Data related to programme costs: Costing data often does not include all costs that contribute to programme outcomes. Important programme inputs such as Ready to Use Therapeutic Food (RUTF) may be received as in-kind donations and thus will not be included in the programme's accounting records. Costs for (e.g.) security, transport, storage and staff may be allocated to (or seconded from) other programmes and not included in accounting records for the programme being assessed. In, for example, an integrated programme delivering CMAM services at government health facilities, you may only have the cost of adding CMAM to an existing primary healthcare programme, which provides resources essential to delivering CMAM that are also not included in the programme's accounting records. Data relating to direct and indirect costs to beneficiary households (e.g. travel costs, lost labour, &c.) are never included in budgetary data. These costs may be considered during programme design and in programme coverage assessments but almost never in budget documents which concentrate on institutional costs. Inclusion of this data will usually require a dedicated survey to collect it [1]. When you use budgetary data, it is important to assess and report on any and all gaps in the budgetary data that you use. In the analysis reported here, the cost estimate used covers:
- Purchase of RUTF from abroad.
- Port handling and warehousing fees for RUTF.
- Transport costs for RUTF from ports to state capitals only (states were responsible for storage and transport to districts, districts were responsible for storage and transport to health facilities).
- Training of staff to deliver the CMAM protocol.
- Monitoring and evaluation activities related to the CMAM programme (excluding coverage assessments).
- Administrative costs at the national level.
The cost estimate used does not cover:
- Purchase and supply of drugs (e.g. antimicrobials) needed to deliver the CMAM protocol.
- Storage and transport of RUTF and other CMAM-related supplies from states capitals to districts and from districts to health facilities.
- Salaries, wages, allowances, and recruitment costs for staff in primary healthcare facilities. The Nigerian CMAM programme is implemented as part of an existing primary healthcare system without employing new staff or raising staff salaries. The incremental value of health workers' time spent implementing the CMAM programme was also not measured for the analysis reported here. It should be noted that salaries, wages, allowances, and recruitment costs usually account for about 50% of the cost of an NGO-delivered CMAM programme.
- Allowances, incentives, and “shadow” labour costs for community-based volunteers.
- Costs of maintaining infrastructure including clinic buildings and equipment.
- Direct and indirect costs to beneficiary households.
- SQUEAC and SLEAC coverage assessments.
The cost estimate used in the analysis reported here covers the costs needed to initiate and deliver CMAM services (excluding salary costs and local transportation costs) within an existing primary healthcare system in eleven states in northern Nigeria.
It is also important to realise that there may be a temptation for service providers seeking funding for continuation or expansion of programmes to underestimate programme costs in order to make the programme look more cost-effective than it really is.
Any counterfactual is based on assumptions, guesses, make believe and some difficult to define and measure data. A counterfactual is a type of fiction. It is important that is it not too much of a fiction. This requires care in selecting and using data and in carrying out calculations. Users of the fiction need to be made aware of the limitations of the data used.
Conclusions
The analysis presented here is simple to do and can be done with readily available (or easily collected) data. It is simple enough to allow current estimates to be produced using updated inputs from routine programme monitoring statistics and budgetary data for inclusion in, for example, monthly or quarterly programme reports and in advocacy material.
It is important to realise that the simple method used here is subject to limitations arising from the data sources used. The main limitation is the use of incomplete cost data. The cost data available to us was the cost to a donor organisation of initiating and implementing a large-scale CMAM programme within an existing primary healthcare programme. Our estimate of the cost per death averted reflects only this cost.
 Different sets of programme costs will be of interest to different stakeholders. Whilst estimates such as those produced and reported here are relevant to donor organisations and some policy makers, they provide a limited understanding of the full extent of resources required/used by a programme. Capturing a more complete set of costs yields data that can inform programme design (e.g. to estimate and minimise costs to beneficiary households) and programme implementation (e.g. to estimate staff time allocation to new services added to existing workloads and avoid “knock-on” quality of care issues). This information can aid our understanding of how much (and what kind of) resources are needed to enable effective implementation. It may prove particularly useful when scaling-up programmes. These methods require additional data to be collected, and using this information will require, for example, judgement on staff cost contributions to CMAM (or other new services).
The simple costing method that we used will always produce lower cost estimates than methods that capture and use a more complete set of costs. Care should always be taken when making comparisons between studies using different methods.
The Nigerian CMAM programme, despite failing to meet SPHERE minimum standards for proportions cured and defaulting in the initial years of operation, has saved a considerable number of lives at a reasonable cost per life saved. This information can be used to advocate for continuation and expansion of the existing CMAM programme.
For more information, contact: Mark Myatt, email: mark@brixtonhealth.com
References
[1] Puett C, Sadler K, Alderman H, Coates J, Fiedler JL, Myatt M, Cost-effectiveness of the community-based management of severe acute malnutrition by community health workers in southern Bangladesh, Health Policy Plan., 2013;28(4):386-399
[2] Briend A, Zimicki S, Validation of arm circumference as an indicator of risk of death in one to four year old children, Nutr Res, 1986;6:249-261
[3] Briend A, Wojtyniak B, Rowland MGM, Arm circumference and other factors in children at high risk of death in rural Bangladesh, Lancet, 1987;26:725-727
[4] Vella V, Tomkins A, Ndiku J, Marshal T, Cortinovis I, Anthropometry as a predictor for mortality among Ugandan children allowing for socio-economic status, Eur J Clin Nutr, 1994;48:189–197
[5] Pelletier DL, Frongillo EA, Habicht JP, Epidemiologic evidence for a potentiating effect of malnutrition on child mortality, American Journal of Public Health, 1993;83:1130-1133
[6] World Health Organisation, World Health Statistics 2014, WHO, Geneva, 2014 (A full set of World Health Statistics reports are available from http://www.who.int/gho/publications/world_health_statistics/en/)
[7] Laxminarayan R, Chow J, Shahid-Salles SA, Intervention Cost-Effectiveness: Overview of Main Messages, in Jamison DT, Breman JG, Measham AR, Alleyne G, Claeson M, Evans DB, Jha P, Mills A, Musgrove P (editors), Disease Control Priorities in Developing Countries (2nd ed.), Washington (DC), World Bank, 2006
[8] Hutton G, Schellenberg D, Tediosi F, Macete E, Kahigwa K, Sigauque B, Mas X, Trapero M, Tanner M, Trilla A, Alonso P, Menendez, Cost-effectiveness of malaria intermittent preventive treatment in infants (IPTi) in Mozambique and the United Republic of Tanzania, Bulletin of the World Health Organization 2009;87:123-129
[9] Bishai D, Adam T, Economics of public health interventions for children in developing countries, in Jones AM (editor), The Elgar Companion to Health Economics, Edward Elgar Publishing, Cheltenham, UK, 2006
1Community Therapeutic Care


