
Nutrition programme coverage: implementation strategy and lessons learnt from the Sahel trip in Chad
 Hermann Ouedraogo, MPH, PhD, is Nutrition Cluster Coordinator with UNICEF Chad. Previously he worked as a SMART Programme Specialist with ACF Canada and managed national surveys in different countries.
 Ismael Ngnie-Teta holds a PhD from the University of Montreal. He is currently Chief of Nutrition for UNICEF Guinea and Adjunct Professor at the University of Ottawa’s School of Nutrition.
 Mahamat Bechir, PhD, is the Responsible of the National Centre of Nutrition and Food Technology, MoH, Chad; this centre led the investigation described in this article with the support of UNICEF.
 Esaie Diongoto Domaya has been working with UNICEF for more than ten years, implementing and monitoring malnutrition management programmes in Chadian emergencies areas.
 Adama N’Diaye is a Nutrition Specialist who worked as Nutrition data manager with UNICEF Chad for three years before joining Niger as responsible for nutrition surveillance.
 Paola Valenti is Nutrition Manger at UNICEF Chad, with a long and successful international experience in nutrition programme management in Nigeria, Cameroon and Madagascar.
The authors are grateful to ECHO/EU that financially supported the investigation. Thanks also to the National Centre of Nutrition and Food Technology and the Ministry of Public Health at large, as well as UNICEF Chad for the logistical organisation and technical input. We also express gratitude to coordinators, team leaders, interviewers and all survey participants.
This article expresses authors’ personal views and opinions and does not necessarily represent UNICEF’s position.
This article was developed through contacts made by the ENN’s Nutrition Exchange editorial team.
Location: Chad
What we know: In general, programmes undertake distinct nutrition surveys and coverage assessments to ascertain programme performance.
What this article adds: An integrated SMART-SQUEAC single survey was implemented in Chad with the aim of economising on time and costs but bearing in mind one sampling constraint (the SMART PPT approach risks underrepresentation of small villages in the coverage assessment). Malnutrition prevalence and coverage data proved of high quality, small villages were represented in this instance, and there were substantial cost savings (103,916 US$). It will be necessary to work out and reconcile appropriate samples, identify eligible children (age versus height cut-offs), consistently define SAM (coverage assessment based on MUAC/oedema; SMART survey based on WHZ/MUAC/oedema) and consider logistics (increased field workers and supervision).
Introduction
The SMART1 methodology was developed to improve the quality and timeliness of nutrition survey results. Similarly, the SQUEAC2 methodology has emerged as the tool for assessing coverage of programmes that implement community-based management of acute malnutrition. Needs assessments, monitoring and evaluation typically require both a nutrition survey to determine needs and a programme coverage survey for assessing performance and refining strategies. Integrating both methodologies in a single survey, while keeping high level data quality, appears highly desirable from a resources-saving perspective. This article describes implementation strategies and lessons learnt from running an innovative integrated SMART-SQUEAC single survey in crisis-affected regions of Chad.
Context
Malnutrition is endemic in Chad. Between 2000 and 2010, the prevalence of chronic malnutrition (stunting) among under five-children increased from 28% to 39% and the prevalence of global acute malnutrition (GAM) increased from 14.6% to 16 % (MICS 2000 and 2010 data). The Sahelian part of the country is the most affected. This critical nutritional situation has led the Ministry of Public Health in Chad to establish an integrated programme of management of acute malnutrition in the 11 Sahel regions, and a twice-yearly nutrition survey to reinforce the nutrition surveillance system.
In 2013, the programme was running 463 outpatient treatment centres, of which 95% were integrated into the national health system, and 32 inpatient treatment units at district hospital level. Admissions are based on three independent criteria: presence of bilateral pitting oedema, mid-upper arm circumference (MUAC) below 115 mm, and weight-for-height z-score (WHZ) below -3. More than 350,000 children under five years of age have been admitted and treated in these centres since 2010. Outpatient dietary treatment is based on the provision of ready-to-use therapeutic food (RUTF) for home consumption.
Following three years of implementation, a programme coverage survey was warranted. This timing coincided with the second of the twice-yearly nutrition surveys due (covering the lean season). We arrived at the decision to combine the two surveys after weighing up advantages with possible inconveniences. We concluded that as long as the survey sample was representative demographically and that the survey was cost-effective and saved time, this would largely outweigh the only possible inconvenience, i.e. the first stage selection of villages, with probability proportional to size, did not fit the coverage survey method (see further explanation later).
Method
The integrated survey was conducted using the SMART methodology for assessing nutritional status while for the coverage assessment, an adapted (SQUEAC) methodology was used. It involved a cross-sectional survey with a two-stage cluster sampling, including anthropometric data collection to determine the prevalence of acute malnutrition (nutrition survey) and identification of cases of severe acute malnutrition (SAM) for coverage-related interviews (coverage assessment).
Planning: Sample size calculation and selection was made separately for each region. For the anthropometric and mortality survey, the ENA (Emergency Nutrition Assessment) software June 2013 version was used. The equations described in the SQUEAC manual were used to calculate the minimum number of SAM cases to include in the coverage assessment. The overall sampling frame consisted of the list of 4739 enumeration areas (EAs) established in 2009 by the national statistics bureau (INSEED), with the number of households per EA. For each of the 11 regions surveyed, the sample was selected using two-stage cluster sampling. First, the clusters were drawn by probability proportionate-to-size (PPT) cluster sampling. In each selected cluster, all children with height below 110 cm in all households were included in the coverage assessment. In practice, during the households’ enumeration in the selected clusters, MUAC and oedema measurements on these children allowed the identification of all SAM cases. Secondly, a systematic random selection of 18 households per cluster was conducted to serve as a sample for the nutrition and mortality survey. MUAC, oedema, weight and height measurements were performed on children aged 6 to 59 months from these selected households.
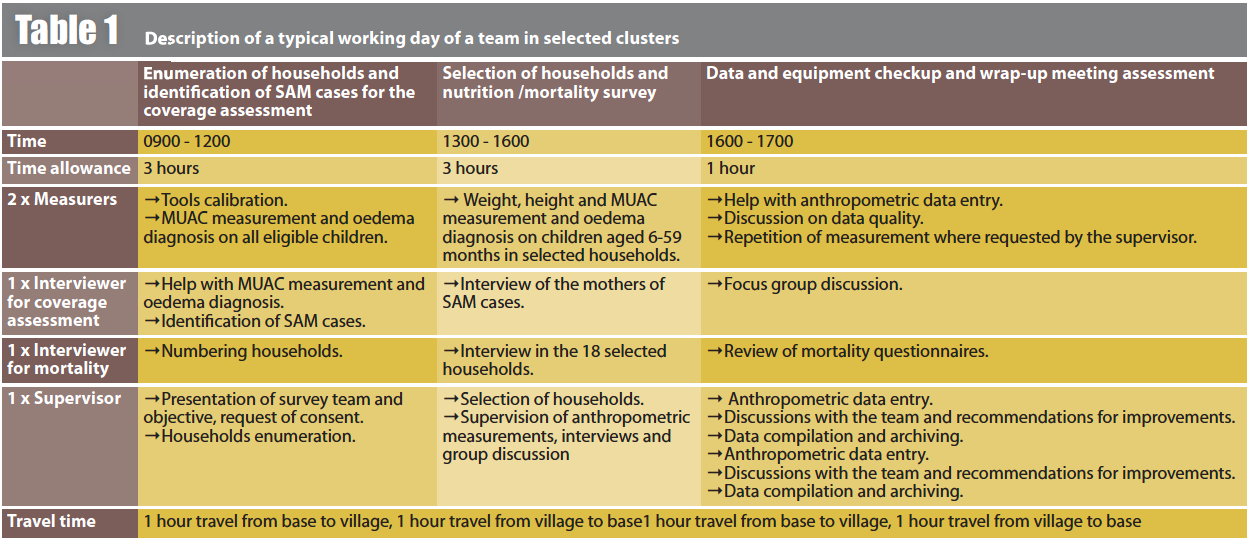
Data collection and analysis: Data collection was carried out from July 8th to August 31st, 2013, by 10 teams, each consisting of two measurers, one interviewer for mortality, one interviewer for coverage assessment and one supervisor. Table 1 describes a typical work day for the team. Data were collected using a questionnaire comprising a mortality section, a section on health and anthropometry, and a coverage assessment section. Nutritional indices were calculated using the WHO 2006 reference population with ENA software (version September 2013); data quality was assessed using the plausibility report produced by this software. Coverage rates were calculated using the BayesSQUEAC calculator (version 3.01).
Challenges and lessons learnt
Technical
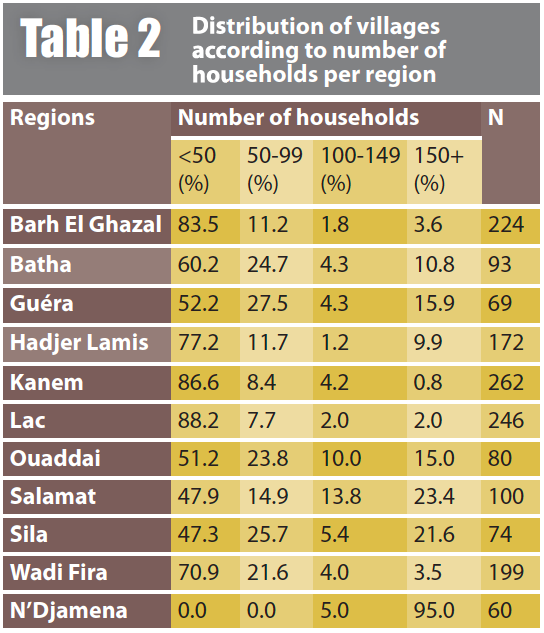
Sampling: To select clusters for coverage assessments, SQUEAC recommends the Centric Systematic Area Sampling (CSAS)-based technique or the use of a list of EAs. If a list is used, simple or systematic random selection should be used rather than the PPT technique that might lead to an under-representation of small villages. Under-representation of small villages is likely to skew coverage rate towards overestimation, since small villages are assumed inaccessible and remote from large cities where health centres are generally established. However, in the surveyed regions, EAs are generally composed of several villages of different sizes, up to 19 villages for a selected cluster in Lac. In all regions, there were villages made up of only one household. This shows that even small villages were well represented in this survey. More than half of the villages had less than 50 households, as shown in Table 2.
Eligibility criteria: To determine the prevalence of acute malnutrition, the inclusion criterion was age 6-59 months. Age determination is very tricky in this context where birthdate is known accurately for less than 10% of children. Events calendar provides valuable assistance for age determination, but it takes time and is impractical to apply to a large number of children. For the coverage assessment, a simple proxy criterion of height below 110 cm was preferred (no minimum cut-off). However, as a proxy of child’s age this can lead to inclusion bias, particularly in regions with high prevalence of stunting, where children older than 59 months may be included. However, SAM is very rare among children whose age is close to 59 months, hence there is a low risk of inclusion. Furthermore, this height criterion is also used by the programme, which includes children with ages of 59 months or below or those with heights below 110 cm.
Definition of SAM for coverage assessment: The programme admissions are based on three independent criteria, in this case, presence of bilateral oedema, MUAC < 115 mm, and WHZ < –3. Complementary analysis of data from previous surveys showed that 76% of children aged 6-59 months with WHZ<-3 had MUAC ranging from 115 to 168 mm and were therefore not detected as SAM by MUAC measurement alone. Ideally, a second weight and height measurement would have been used in children with MUAC 115-168 mm in order to detect all SAM cases as per the programme definition. However, such weight and height measurements proved too time-consuming to be performed on such a large number of children. For the coverage assessment, the only criteria used were presence of bilateral oedema and MUAC < 115 mm. In these circumstances, the sample size becomes more difficult to achieve, leading to a risk of bias affecting coverage rates – probably over-estimation. Indeed, it is likely that MUAC-based SAM coverage is higher than that of WH-based SAM, because of the prioritisation of MUAC measurement by community volunteers, leading to greater detection and referral of MUAC-based SAM cases.
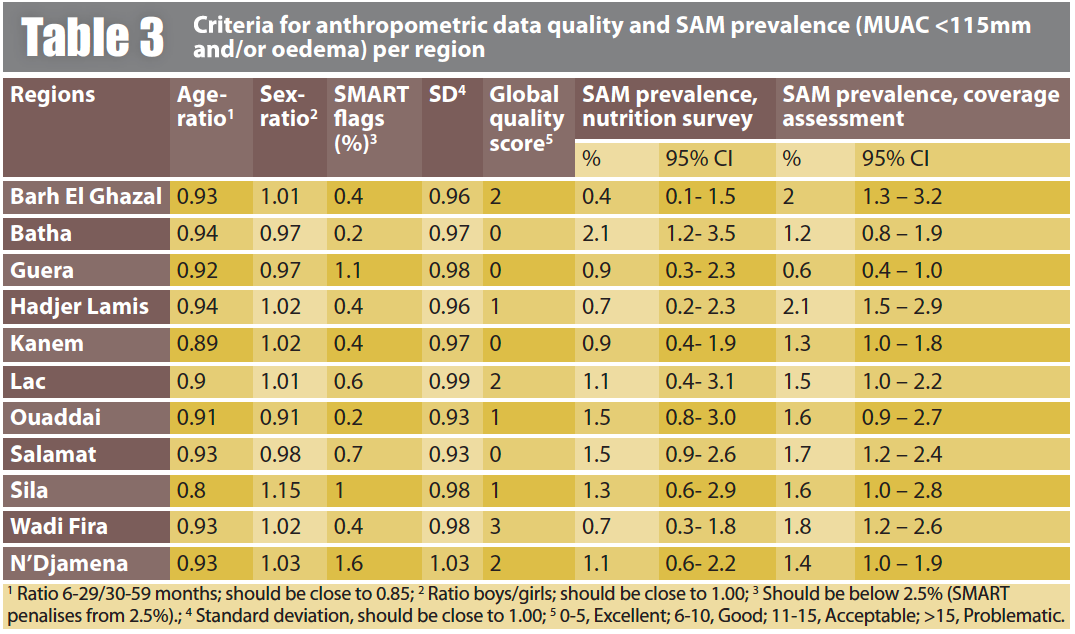
Data reliability and validity: Data in Table 3 indicate excellent quality sample selection and anthropometric measurements. Furthermore, the prevalence of SAM (defined as MUAC < 115 mm and/or oedema) resulting from measurements in selected households in the nutrition survey, were close (with overlapping 95% confidence intervals) to those from the coverage assessment. With respect to external validity, the prevalence and trend of acute malnutrition were as expected given the prevailing context, i.e. agricultural production and food security. Similarly, coverage rates were within the expected limits, taking into account the results of recent assessments in some regions, as well as field observations.
Operational
Fieldworkers’ selection, training, and team composition: In preparation for the deployment of 10 teams of five people (one more than is usual for a SMART team), a total of 50 to 60 people required training. Since potential fieldworkers did not require interview and focus group discussion experience, some training sessions were longer that planned, i.e. role-playing interviews. Piloting separate training sessions for staff involved in mortality interviews and in coverage interviews could provide more insight into the ideal training strategy.
 Logistics and supervision: SQUEAC integration with SMART involved an additional person in each field team, as well as additional forms for SAM enumeration, interviews and discussions. Therefore, more suitable training and more practice on anthropometric measurements were needed. The standardisation test was more difficult for children and their caretakers because of the higher number of measurements to be performed on each child. Vehicles adapted for the transportation of 5-member teams were also required. The need for supervision level was increased, justifying the permanent presence of the supervisor with the team. This form of ‘integrated supervision’ allowed for follow up of households and SAM enumeration in phase 1. This meant that workload could be more easily shared by moving back-and-forth between mortality and coverage interviewers (see Table 3 on organisation on a typical day).
Duration: The average duration of data collection was estimated at 51 days per team for a simple SMART survey, rising to 53 days with integration of SQUEAC. Additional time needed was due to reassessment of the number of households to investigate per day, which decreased from 20 to 18 per day per team; in turn, this resulted in an increase in the number of villages from 404 (i.e. 41 per team) to 430 (i.e. 43 per team). Also, one rest day per week was allowed for each team.
Cost
The cost for data collection, excluding logistics (vehicles and fuel), was 137,796 US$ for the simple SMART survey whereas the integrated survey cost 163,107 US$ — a difference of 25,311 US$. This added cost was due to the 10 additional people admitted to training, the extra person in each of the 10 teams, the second village guide to accompany the coverage interviewer, the two additional days for data collection and five additional days for data entry. A simple SQUEAC survey conducted in similar conditions would have cost 78,363 US$, i.e. there was an overall savings of 53,052 US$ for doing both surveys. If logistic costs are included, the total costs were 243,666 US$ and 268,977 US$ for the simple SMART survey and the integrated survey, respectively. A simple SQUEAC survey conducted in similar conditions would have cost 129,227 US$. Conducting an integrated survey, rather than two distinct surveys, has therefore allowed a total saving of 103,916 US$.
Conclusions
SMART and SQUEAC survey methodologies can be combined in a single survey while maintaining a high quality for prevalence and coverage data, as well as substantially saving programme resources. It will be necessary to work out and reconcile appropriate samples, identify eligible children and to define SAM. Similarly, logistic arrangements need to be carefully considered in order to accommodate the increased number of fieldworkers and supervision workload.
For more information, contact: Hermann Ouedraogo, email: houedraogo@unicef.org
1Standardised Monitoring and Assessment of Relief and Transition
2Semi Quantitative Evaluation of Access and Coverage