
Linking agriculture with nutrition within SDG2: making a case for a dietary diversity indicator
 By Anna Lartey
Anna Lartey is Director of FAO’s Nutrition Division within the Economic and Social Development Department at FAO in Rome. She was a Professor of Nutrition at the University of Ghana for 29 years. Her research focused on maternal child nutrition. She was a recipient of the International Development Research Centre (IDRC, Canada) Research Chair in Nutrition for Health and Socioeconomic Development in sub-Saharan Africa. She is also the recipient of the Sight and Life Nutrition Leadership Award for 2014. Dr Lartey is also the President of the International Union of Nutritional Sciences (IUNS, 2013-2017).
The essence of this article featured as a key note presentation in the 5th annual research conference of the Leverhulme Centre for Integrative Research on Agriculture and Health (LCIRAH), at the London School of Hygiene and Tropical Medicine, London, on the 3rd and 4th of June, 2015.1
Main Messages:
- Undernourishment and undernutrition, including micronutrient deficiencies, have decreased in the last 20 years, but are still major challenges.
- Over-weight and obesity are increasing and are now prevalent in most countries, even those where undernutrition persists.
- Trends in the global food supply – namely heavy investment in cereals and underinvestment in non-staples – have created a situation where the cost of a healthy diet can be very high and the incentives to eat highly processed foods of minimal nutritional value are strong.
- These trends have contributed to the “perfect storm” for the double burden of malnutrition which is now common-place.
- Tackling these issues requires strengthening the links between agriculture, a healthy and affordable food supply, diet quality, and nutrition.
- A new focus on diet quality in high level political discourse is key to strengthening these links.
- Indicators of diet diversity are essential for assessing diet quality; as such they should be included in the SDG on food security and nutrition.
What does malnutrition look like in 2015?
While most of the world’s hungry people are still in South Asia, followed by East Asia and sub-Saharan Africa, Asia’s share in terms of absolute numbers has decreased markedly, while that of Sub Saharan Africa’s has considerably increased. Overall, the prevalence of undernourishment in developing countries has declined since 1990; however the rate of decline has slowed in recent years.
In line with undernourishment or hunger2 trends, undernutrition (stunting and wasting) is also declining, albeit too slowly. Stunting and underweight remain high in many countries, especially in Africa, as do micronutrient deficiencies, most notably in iodine, iron and vitamin A.3 4
At the same time that these trends in undernutrition persist, overweight and obesity are rising so much so that in many countries, undernutrition, micronutrient deficiencies and overweight and obesity now co-exist and present within the same populations and in some countries, in the same households.
Nutrition transition and global shifts in diet quality
What is driving this “double burden of malnutrition”? Often referred to as the “nutrition transition”, the causes are complex and linked to rapid socioeconomic, demographic and technological changes, most of which are, themselves, linked to globalisation. These include changes in technology regarding how food is processed, marketed and prepared and changes in meal patterns. The end result is major shifts in diet patterns, characterised by increased total energy intake. While the latter includes increased intake of animal source foods and vegetable oils, as well as a small increase in global fruit and vegetable intake, most of the foods that people are eating more of are cereal-based.
Indeed between 1965 and 1999 in developing countries, growth in cereal production was over 100%, outpacing population growth; gains in pulse production during this same period remained relatively low, averaging well below 50%. The low production of pulses can be considered a rough indicator for all kinds of non-staple foods including fruits and vegetables, none of which have increased at anywhere near the rate of cereals, namely because agricultural research and other types of investment during this period was strongly biased towards cereal production.5 6
Consequent declines in cereal prices have been followed by dramatic increases in the price of non-staple foods, effectively raising the “price” of diet quality and contributing to the afore-mentioned persistence of vitamin and mineral deficiencies. For example, in Bangladesh, prices for cereals, non-cereal plant foods and animal source foods were roughly equal in 1975. By 1996, cereal prices had decreased substantially while prices for non-staple foods had increased. The end result, especially for poorer families, was an increase in the percentage share of household food expenditures on non-staple foods, with a concomitant decrease in actual intake of those foods. The implication is that households will spend more of the food budget on non-staple foods, but these foods comprise only a modicum of total energy intake.7
Until the year 2000, cereal prices were in decline, assuring that at very least, the world’s poor were assured in terms of total energy intake. However in the last decade, cereal prices have themselves begun to rise, increasing food budget expenditures on staples at the expense of whatever small amounts of higher nutrient foods were being consumed. The end result is that in recent years, the “cost” of diet quality is higher than ever.
Revising conventional food security paradigms
As previously mentioned, today’s global food systems have been shaped by trends in agricultural research and investment over the past thirty years. These trends are in line with conventional food security paradigms which put the focus squarely on physical food availability at a national or sub-national level, usually assessed in terms of net food production and cereal stock levels. While national food availability is an obvious pre-requisite for total food security, it is not the whole story, as it does not necessarily reflect what foods households are growing and able to afford, let alone what individuals are actually eating. These dimensions of food security are typically referred to as “household food access” and “individual utilisation”.
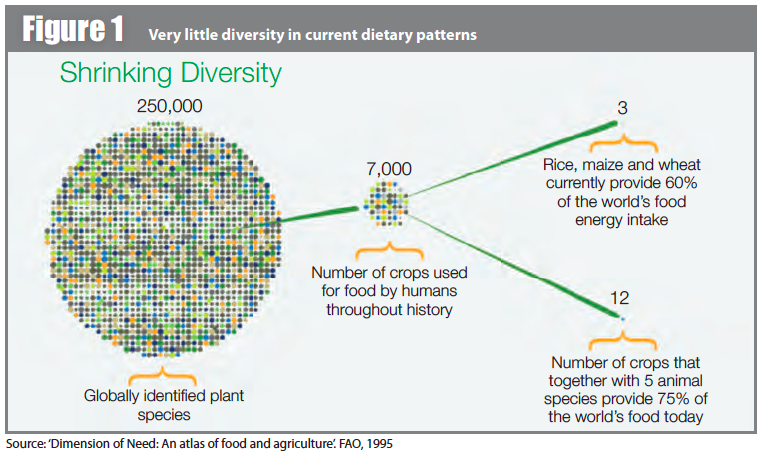
Tackling malnutrition in all its forms requires revision of conventional food security paradigms to better include these dimensions. Doing so requires revisiting the cereal-centric support policies that have characterised the last three decades of agricultural policy in favour of an investment agenda that promotes production diversity. Figure 1 shows just how far we have to go in terms of achieving this goal. To date, there are over 250,000 globally identified, edible plant species; historically, 7,000 of these have been used for food by humans. Currently, three crops – rice, maize and wheat - provide over 50% of the world’s energy intake, and 12 (including five animal species) provide 75%.8 No wonder there is so little diversity in today’s diets.
Prioritising diet diversity: a key indicator for improving diet quality
How then do we meet the challenge of increasing the nutrition sensitivity of today’s global food system? How can we lower the “price” of diet quality in the hopes of increasing nutrient adequacy and decreasing excessive energy intake?
A stronger, more explicit focus on diet diversity is now increasingly recognised as an important strategy in achieving these goals. Indicators of diet diversity are typically constructed from scores for individual food consumption which are computed based on information on the number of different food groups from which the individual consumed over a recent short period of time. Diet diversity scores have been repeatedly validated as having a robust and consistent positive statistical association with adequacy in individual micronutrient consumption. In other words, the higher the diet diversity score for an individual, the more likely that individual has a diet which meets his or her vitamin and mineral requirements.9
Associations have also been reported between diet diversity and other outcomes, including cognitive function, all-cause mortality in the elderly10 11 and wasting in children.12 Diet diversity is relative simple to measure and relevant across a variety of cultures. Moreover, all national food-based dietary guidelines include this dimension.
In July 2013, FAO and partners announced a new development in diet diversity scores: consensus on a threshold metric to classify women as having high or low diet diversity. Referred to as the MDD-W or Minimum Dietary Diversity for Women, this indicator measures the percent of women, 15-49 years of age, who consume at least 5 out of 10 defined food groups. The development of the MDD-W offers a unique opportunity to systematically survey women’s diet diversity, thus facilitating assessment of diet quality at population level.
Leveraging current opportunities
Jointly organised by the FAO and the WHO, the Second International Conference on Nutrition (ICN2) was an inclusive inter-governmental, high-level ministerial conference on nutrition. The primary outcome documents were the Rome Declaration on Nutrition and an accompanying Framework for Action.13 Both documents place strong emphasis on the role of food systems in improving nutrition, in particular through the adoption of policies and legal frameworks, which enhance the availability and accessibility of safe and nutritious foods and which ensure healthy diets throughout the life course (Commitment 7 of the Rome Declaration). Specific recommendations from the Framework for Action are as follows:
- Integrate nutrition objectives into agriculture and food policies
- Promote diversification of crops
- Improve storage….reduce seasonal food insecurity, food and nutrient loss and waste
- Develop international guidelines on healthy diets
- Gradual reduction of saturated fat, sugars, salt/sodium and trans-fat from food and beverages
These messages are reiterated in Goal 2 of the Sustainable Development Goals (SDGs): End hunger, achieve food security and improved nutrition and promote sustainable agriculture.
These high level political documents offer unprecedented opportunities to advocate for the prioritisation of nutrition within agriculture. As such, they also offer an unprecedented opportunity to advocate for a stronger focus on diet quality as a way to measure progress in achieving food security that goes beyond the conventional focus on cereal stock levels, to assure increased production diversity with implications for the food supply and nutrition.
The proposed indicators for this SDG - proportion of the population below the minimum level of dietary energy consumption; prevalence of anaemia in women; and prevalence of wasting and stunting in children under 5 – do not capture this consideration.
Given this situation, and the subsequent risk of continuing to fall short of our goals for improving food security and nutrition for all, for reducing the triple burden of malnutrition, and for improving the quality of the food supply for millions of people worldwide, it is imperative that we leverage the precedent set during the ICN2 to advocate for inclusion of the MDD-W as an indicator for SDG 2. Simply put, diet diversity underpins a healthy diet. As such, an indicator of diet diversity like the MDD-W should be used to promote agricultural policies that go beyond “business as usual” and look towards a more nutrition-sensitive paradigm that prioritises production of diverse, nutrient-rich foods for all.
For more information on the MDD-W, visit the FANTA website.
Footnotes
1http://www.lcirah.ac.uk/5th-annual-conference
2Undernourishment means that a person is not able to acquire enough food to meet the daily minimum dietary energy requirements, over a period of one year. FAO defines hunger as being synonymous with chronic undernourishment. For more information on trends, see http://www.fao.org/hunger/en/
3Levels and Trends in Child Malnutrition: UNICEF, WHO, World Bank Joint Estimates 2014. Available online as of June 24, 2015 here
9Ruel, M., J. Harris, and K. Cunningham. 2013. "Diet Quality in Developing Countries." In Diet Quality: An Evidence-Based Approach, Volume 2. V.R. Preedy, L.-A. Hunter, and V.B. Patel (eds.). 239-261. New York: Springer.
10Chen, R.C., Chang, Y.H., Lee, M.S., Wahlquist, M. (2011). Dietary quality may enhance survival related to cognitive impairment in Taiwanese elderly. Food Nutrition Research. 2011;55
11Lo, Y.T., Chang, Y.H., Wahlquist, M., Huang, H.B., Lee, M.S. (2012). Spending on vegetable and fruit consumption could reduce all-cause mortality among older adults. Nutrition Journal 11:113.
12Amugsi, A., Mittelmark, M.B., Lartey, A. (2014). Dietary Diversity is a Predictor of Acute Malnutrition in Rural but Not in Urban Settings: Evidence from Ghana. British Journal of Medicine & Medical Research 4(25): 4310-4324.