
National and local actor’s share of global humanitarian funding
Summary of report1
Location: Global
What we know: Emergency aid funding has risen tenfold in the last 14 years.
What this article adds: A recent review of national and locals actor share of global humanitarian funding demonstrates how conventional emergency aid money flows overwhelmingly to UN agencies, big western-based charities and the Red Cross / Red Crescent Movement. A tiny fraction is supplied directly to frontline charities in the affected countries. Four percent of the total number of emergency aid agencies received about 85 percent of the total funding reported. Current reporting and tracking of funding flows to national and local actors is severely limited, compromising transparency and accountability. Recommendations to contribute to the World Humanitarian Summit 2016 discussions include development of a classification system for types of L/NNGOs and the nature of funding ‘partnership’ and humanitarian agency commitment to report funding flows.
Since 2010, the Local to Global Protection Initiative (L2GP) has published a number of studies of major humanitarian crises. All studies stress the importance of local and community led responses to protection threats but also demonstrate that genuinely locally-led responses are poorly understood and only very rarely supported by international humanitarian and protection actors. In the discussions leading up to the World Humanitarian Summit in 2016, locally-led humanitarian responses are gaining some attention with advocacy for increased funding flows to local and national non-governmental organisations (NGOs) and investment in local capacity building. A recent briefing note, ‘Funding flows to national and local humanitarian actors,’ supported by a set of online interactive visualisations,2 demonstrate current inequalities in the global humanitarian funding system. Some of the key observations are outlined below.
Data sources
There are two main sources of data on humanitarian funding: the Development Assistance Committee (DAC)3of the Organisation for Economic Co-operation and Development(OECD)4 and the Financial Tracking Service (FTS)5 of UN OCHA.6 Another annual publication, the Global Humanitarian Assistance,7 combines the two data sources adding its own research and analysis. Data reported to FTS is considerably smaller than the overall humanitarian response as reported by the GHA reports.
For 2013, the GHA data (coded from OCHA FTS sources) includes direct funding flows to LNGOs and NNGOs from the UN pooled funds, Common Humanitarian Funds (CHF) and Emergency Response Funds (ERF), a few foundations, private individual and organisations, and nine DAC donors
How funding flows through the humanitarian system
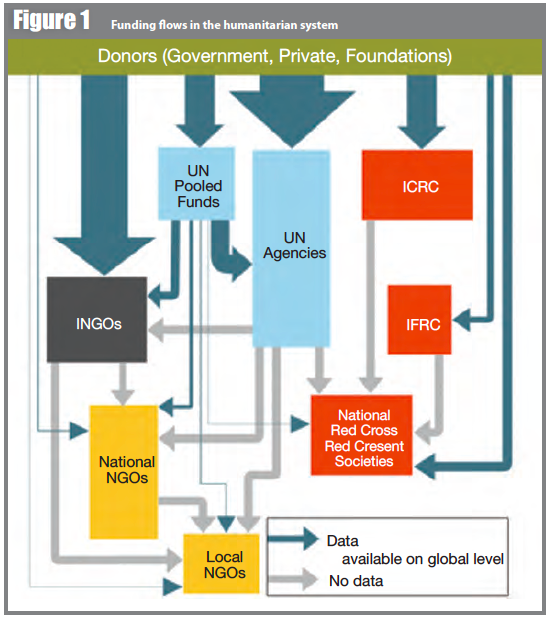
Money within the humanitarian system usually flows through several entities before (parts of) it are realised as protection and assistance to the intended ‘end user’ – individuals in need. At the first level (‘direct funding’) most funding flows from an original donor (governmental or private) to UN agencies, international NGOs, UN pooled funds or the Red Cross/Red Crescent system. Only a small fraction of the funding from the original donors is received by national and local NGOs. This ‘direct’ funding channel is relatively well documented and a fair amount of information about donors and recipients and the size of this funding flow are available. From these ‘first level recipients’ (primarily international agencies and organisations) some funding is sub-contracted to other international organisations as well as national and local actors in order for them to carry out activities. However, when trying to track this ‘indirect’ funding through second, third or fourth levels of the humanitarian system, comprehensive information are not available. This is reflected in Figure 1, where blue arrows indicate the relative volume of the specific ‘direct’ funding flow, whereas the grey arrows are uniform in size as no reliable global level data are available regarding the actual or relative volume of these ‘indirect’ funding flows.
Global humanitarian funding 2000 – 2014
Humanitarian funding from governments, private donations, foundations and organisations dramatically increased from around USD two billion in 2000 to more than USD 22 billion in 2014. According to data as reported to the UN, the largest amounts of funding come from individual governments and the EU. Significant peaks in 2005 and 2010 were most likely related to donor responses to the tsunami in the Indian Ocean in December 2004 and the earthquake in Haiti in early 2010.
Figure 2 shows, in descending order, the 29 humanitarian agencies, governments and institutions, which received the most humanitarian funding in 2013 according to OCHA FTS; local and national NGOs (L/NNGOs) do not feature (an interactive version of this chart is available online.8 They constitute less than 4% of the recipients of humanitarian funding reported to OCHA FTS but between them, they receive more than 85% of the total first level (‘direct’) funding from large institutional donors. Just 10% of the organisations receive more than 90% of the funding.
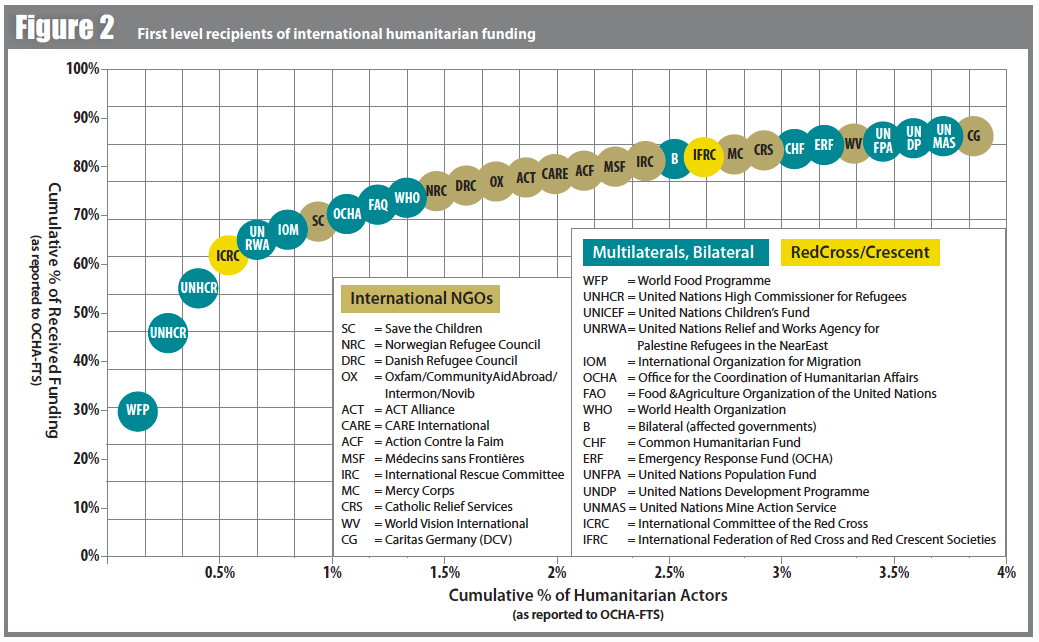
Figure 3 shows the first level recipients of the international humanitarian funding in 2013. The size of the various humanitarian actors in this graphical representation equals their annual first-level recipient humanitarian budget.
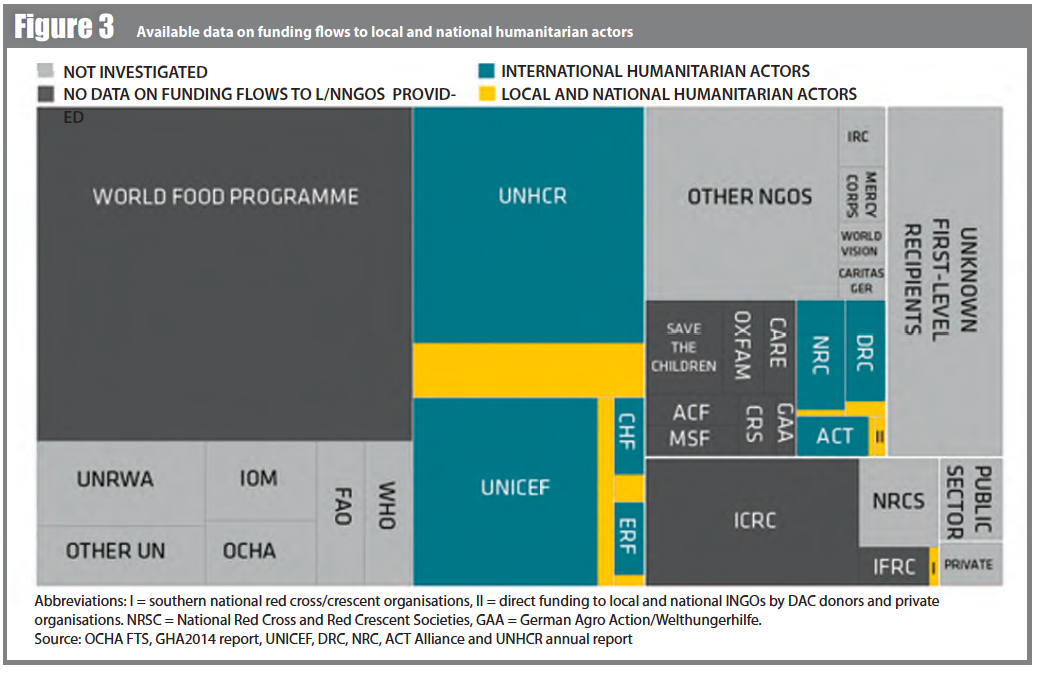
Abbreviations: I=southern national red cross/crescent organisations, II=direct funding to local and national lNGOs by DAC donors and private organisations. NRSC=National Red Cross and Red Crescent Societies, GAA=German Agro Action/Welthungerhilfe, Source: OCHA FTS, GHA2014 report, UNICEF, DRC, NRC, ACT Alliance and UNHCR annual report.
The Gini coefficient9 is a widely-used measure of inequality, which ranges from 0 (every person/organisation has the same amount of money) to 100 (one person/organisation got everything, the others nothing). The Gini coefficient for the humanitarian “economy” is about 95, showing a very high degree of market concentration.10
Direct funding to L/NNGOs
According to the Global Humanitarian Assistance (GHA) 2014 Report, ‘direct’ funding flows to national and local actors11 (based in the countries where emergencies unfold) are only known to have received respectively USD 40 million and USD 9 million in 2013 (0.2%) out of the USD 22 billion.. In the period between 2009 and 2013, L/NNGO NGOs received 0.2% (USD 212 million) of the international humanitarian response. This represents 1.6% of the resources given to all NGOs (INGOs, NNGOs and LNGOs) in that period. Both in the period between 2009 and 2013, and considering 2013 only, NNGOs received about 80% of these funding flows while LNGOs only received about 20%. The very modest size of local and national funding is a persistent feature of global humanitarian funding flows.
In 2013, almost 70% of the total known direct L/NNGO funding came from the OCHA managed pooled funds ERFs and CHFs. Based on the data submitted to OCHA FTS by ERFs and CHFs, GHA’s data of funding flows to local and national NGOs differs starkly from the data presented in the annual reports of these pooled funds. The magnitude of differences is approximately 100% and is due to different definitions of local/national NGOs.
In 2013 international donors and pooled funds channelled USD 1.2 billion directly to the Red Cross/Crescent System. Out of this funding, 72.5% were received by the ICRC, 16.0% by national societies, which are DAC members (‘northern’ national societies (N)), 7.1% by the IFRC, and 4.3% by national societies, which are not DAC members (”southern” national societies). These southern members worked in a similar way to international NGOs by implementing projects abroad (3.4%), or worked within the country in which they are based (0.9%).
Indirect funding to L/NNGOs
UN agencies
The largest multilateral first-level recipient of humanitarian funding is WFP who worked with 1162 national NGOs and community based organisations in 2013, who in turn distributed approximately one third of the 3.2 million metric tons of food commodities in that year. WFP has no data available on how much of its annual humanitarian budget is made available for national and local NGOs but suggests that such data could be available after activating its new financial tracking systems later in 2015.
UNHCR publishes figures on funding flows to local and national humanitarian actors. In 2013, USD 389 million (18.7 %) were allocated to 567 local and national humanitarian actors.
While UNICEF does not officially publish funding flow data, data was made available: in 2012, USD 63.5 million (or 7.6% of its annual budget) went towards funding 595 national and local humanitarian actors, which have a partnership agreement with UNICEF. Out of this amount, USD 3.4 million went to national Red Cross/Crescent Societies. UNICEF also provides funding to L/NNGOs which work under service providers contracts (no data available on these disbursements).
INGOs
Ten of the largest international NGOs were asked to report on their funding flows to national and local NGOs. Only three of the INGOs/alliances provided any data on the amount of funding they channelled to local and national NGOs: The Danish and Norwegian Refugee Council (DRC and NRC) and the ACT Alliance. In 2013, DRC spent USD 17.3 million on 150 different local and national NGOs which amounts to 5.6% of its annual humanitarian budget. The NRC spent USD 8.6 million on L/NNGOs which amounts to 2.66% of its annual humanitarian budget. The ACT Alliance could provide partial data for 34.8% of a 100 million USD budget. Of this, USD 6.7 million (19.3%) was channelled to 24 local and national NGOs.
ICRC/IFRC
ICRC and IFRC could not provide data on internal funding flows/flows to national societies.
Conclusions
Funding flows to national and local organisations appear very modest compared to the crucial importance of local responses. The current reporting and tracking of funding flows to national and local actors is so limited and so lacking in terms of quality, consistency and depth of detail, that it is hardly possible to establish a single overall actual figure or percentage with a reasonable degree of certainty. Furthermore, there is little information on the nature and quality of the partnerships and collaboration with L/NNGOs. Given the importance of local actors in humanitarian crises throughout the world, this finding in itself could indicate a failure in transparency and accountability for the global humanitarian system as a whole.
Suggestions currently under discussion in global fora include a minimum of 15% of donors, UN agencies and INGOs’ humanitarian funding should be directed to NNGOs or 20% of all global funding to go to local organisations by 2020 or country level pooled funds (CHF/ERF) should allocate 50% of their funds to national NGOs. Based on the findings of this report, the authors make a number of further recommendations for consideration during the dialogue leading to, and at, the World Humanitarian Summit 2016:
- All humanitarian actors (donors, international and national/local agencies and NGOs) should make detailed data about funding flows available in a form, which is transparent and universally recognisable.
- A sufficiently nuanced and universally agreed classification system for types of L/NNGOs and the nature of the funding collaboration (‘partnership’) is required in order to improve the ability to analyse more qualitative aspects of future trends.
- Relevant data collecting and processing entities such as DAC, OCHA FTS, GHA and the International Aid Transparency Initiative (IATI)12 may, in cooperation with relevant local and national authorities and NGO coordination forums, lead in developing and agreeing universally replicable reporting criteria, classifications and tracking modalities.
For more information, contact: Nils Carstensen, L2GP project manager, email: info@local2global.info
A series of interactive graphs and figures by Christian Els (who worked on the visualisation graphics) and Nils Carstensen are jointly published with IRIN as a companion to the L2PG study on humanitarian financing. Graphics are available at: http://www.local2global.info/wp-content/uploads/funding_flows.html
For further work by IRIN on the humanitarian economy, visit: http://newirin.irinnews.org/the-humanitarian-economy/including a new report on reforming the humanitarian financing system, http://www.irinnews.org/report/101694/it-s-all-about-the-money
1Christian Els & Nils Carstensen. Funding flows to national and local humanitarian actors. May 2015. http://www.local2global.info/wp-content/uploads/l2gp_local_funding_final_250515.pdf
2http://www.local2global.info/wp-content/uploads/funding_flows.html
7http://www.globalhumanitarianassistance.org/
8http://www.local2global.info/wp-content/uploads/funding_flows.html
9https://en.wikipedia.org/wiki/Gini_coefficient
10https://en.wikipedia.org/wiki/Market_concentration
11In this briefing note, the term ’local and national NGOs’ or L/NNGOs refers to the collective of national and local NGOs as defined in GHA Report 2014 while the term ‘local and national humanitarian actors’ includes national Red Cross/Crescent Societies.
12http://www.aidtransparency.net/