
Use of a two-stage approach to identify intervention priorities for reduction of acute undernutrition in Abaya district of Ethiopia
By Katja Siling, Asrat Dibaba and Mark Myatt
Katja Siling is an independent consultant helping organisations increase their learning capability and fulfil their mandate through evaluation and research. She has worked with various international and UN organisations and managed projects in Africa and Asia.
Asrat Dibaba is the Director for Health, Nutrition and HIV/AIDS Learning Centre for World Vision East Africa Region based in Nairobi. He has worked in Ethiopia, Liberia, Sudan and Cambodia.
Mark Myatt is a consultant epidemiologist and senior fellow at University College London. His areas of expertise include infectious diseases, nutrition, and survey design.
 The authors would like to acknowledge the following people for their support in the conduct of the research: Adisu Zekwos, ADP Manager, World Vision Ethiopia; Tesfaye Jima, HIV & AIDS Technical Specialist, World Vision Ethiopia; Sisay Sinamo, Nutrition Advisor, World Vision East Africa Region; and Jose Luis Alvarez of Action Against Hunger (ACF), who identified the need for a low-cost method and reviewed the initial concept note.
Location: Ethiopia
What we know: Good, context-specific information is key to selection and design of effective nutrition-sensitive programming.
What this article adds: In 2014, World Vision piloted an approach in Abaya, Ethiopia that combined data from a case-control study and a cross-sectional survey to identify probable and important causes of undernutrition to inform nutrition-sensitive programming. A matched case-control study identified probable causes (exposures) and their strength of association; access to safe drinking water and infection (i.e. diarrhoea, cough, malaria) were identified as the probable main contributors to undernutrition in children. A cross-sectional survey assessed their prevalence; this was used to estimate population attributable risk that informed selection of water, sanitation and hygiene (WASH) and health interventions. In Abaya it was estimated that interventions targeting diarrhoea, cough, lack of mosquito nets and poor access to safe drinking water could help prevent 92% of severe acute malnutrition (SAM) cases if they are 80% effective and have at least 50% coverage. The two-stage approach is relatively cheap, quick, and can be tailored to programme needs; cost data can be added.
Undernutrition is a major cause of mortality in children and it is also an underlying cause of child deaths associated with other illnesses, such as pneumonia and malaria (Laura, Caulfield, de Onis et al, 2004). Infectious diseases, food security, feeding practices, water and sanitation, and access to health service all impact the nutritional status of children and adults. An integrated and multi-sectoral response addressing a broad range of the determinants of undernutrition is, therefore, more likely to be effective in decreasing the incidence, prevalence, and severity of undernutrition than any single intervention. We might term this integrated approach “nutrition-sensitive programming”. Nutrition-sensitive programming holds great promise for improving nutritional outcomes and enhancing the coverage and effectiveness of nutrition-specific interventions (Ruel & Alderman, 2013). Such an approach to programming is endorsed by an increasing number of humanitarian organisations and non-governmental organisations (NGOs) aiming to reduce the incidence of malnutrition and its sequelae.
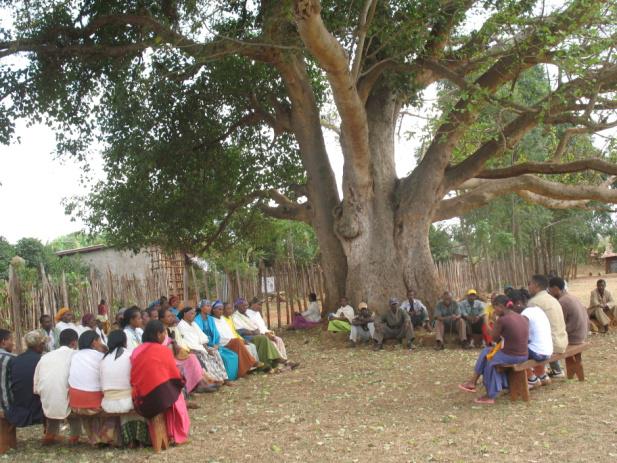
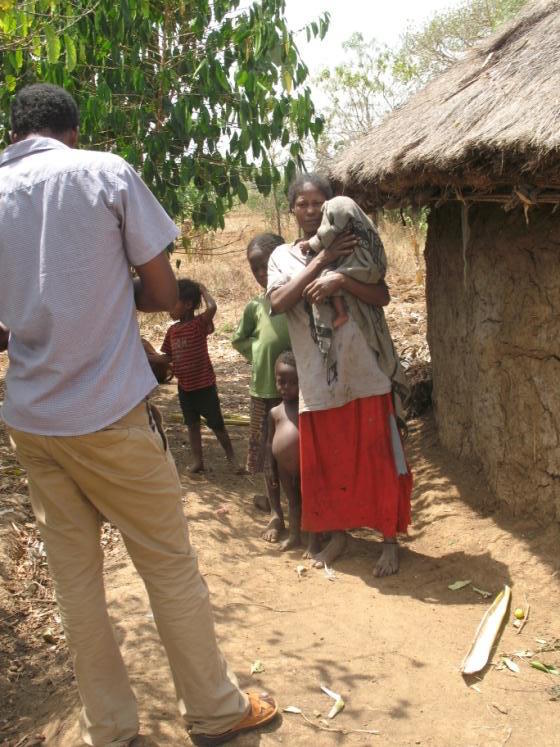
In this article we describe a two-stage approach to providing information needed for planning nutrition-sensitive programming, which we define as the selection and design of practicable interventions against probable and important causes of undernutrition. By combining data from a case-control study and a cross-sectional survey we can identify probable important causes of undernutrition and assess the likely impact of interventions. World Vision (WV) piloted this approach in April-May 2014 in Abaya district in Oromia region of Ethiopia, where undernutrition in children under five years remains a significant problem. The objective of the pilot was to prioritise interventions and inform programme strategies for the prevention of undernutrition in children. This article describes the methods used and our experiences with this pilot.
 Probable causes
Most epidemiological studies are observational. This means that they find associations between exposures (putative causes) and outcomes (disease). An observed association may point to a real cause or may be due to chance, bias, or confounding (i.e. due to an association between a factor and exposures that are more directly associated with the outcome of interest). The effects of chance, bias and confounding can be minimised by careful design and execution of studies (i.e. in terms of sample size, clear and appropriate definitions for cases and controls, instrument design, data-quality, supervision, stratification, and matching). A number of data-analytical techniques (e.g. stratified analysis, logistic regression, conditional logistic regression) are available that can identify and control for confounding. Case-control studies have considerable advantages in terms of practicability (e.g. cost, rapidity) and statistical power over other study designs. A matched case-control design for nutrition causal analysis has been developed and tested as part of the SQUEAC (semi-quantitative evaluation of access and coverage) toolbox (Nwayo & Myatt, 2012), (Ratnayake, Tesfai & Myatt, 2013), (Tesfai, Ratnayake & Myatt, 2013).
Important causes
The importance of a cause is determined by both (1) the strength of the association between an exposure and the outcome of interest, and (2) the prevalence of that exposure. It is measured by the population attributable risk (PAR):
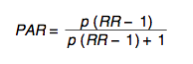
where RR is the risk ratio associated with an exposure (this is a measure of the strength of association between an exposure and an outcome) and p is the prevalence of exposure in the population.
The PAR provides an indication of the amount of the incidence of disease that can be attributed to a specific exposure or the percentage reduction in the incidence of a disease that could be expected in a given population if the exposure were eliminated entirely.
Probable and important causes
Identifying probable and important causes is, in the approach described here, a two-stage process:
- A matched case-control study identifies probable causes (exposures) and their strength of association with the outcome of interest (undernutrition).
- A cross-sectional survey estimates the prevalence of the identified exposures (probable causes).
Stage one: Matched case-control study
A semi-quantitative causal analysis combining qualitative investigation and a matched case-control study was carried out with the aim of identifying probable causes of undernutrition following the SQUEAC causal analysis method (Ruel & Alderman, 2013), (Nwayo & Myatt, 2012), (Ratnayake et al, 2013). The qualitative stage collected data from a wide range of informants (i.e. village leaders, community health workers, mothers, fathers, WV staff) using a variety of methods (i.e. semi-structured interviews, informal conversations, focus group discussions) and identified a number of potential risk factors/exposures for further investigation. The quantitative stage was a matched case-control study. Thirty-four cases (current SAM cases) were recruited from health centres delivering Community-based Management of Acute Malnutrition (CMAM) services and from the community by active case-finding. Cases were matched with 136 controls (children without SAM, moderate acute malnutrition (MAM), or global acute malnutrition (GAM) based on age and sex (i.e. four matched controls for each case). The following potential risk factors were positively associated with undernutrition in a bivariate analysis and further investigated:
- No access to safe drinking water
- Household without livestock
- Household hunger
- Inadequate meal frequency
- Inadequate dietary diversity
- Recent fever
- Recent diarrhoea
- Recent vomiting
- Recent cough
- Not sleeping under a mosquito net
- Short birth interval
These potential risk factors for undernutrition were entered into a conditional logistic regression model and non-significant variables were removed using stepwise backward elimination. Birth interval as a risk factor was not included in the model due to there being too many missing values.
After removal of non-significant variables from the model, the final model contained only variables with significant and independent associations with being a case. These were:
- No access to safe drinking water
- Recent diarrhoea
- Not sleeping under a mosquito net
- Recent cough
The strengths of the association between these exposures and SAM were calculated using the odds ratio (OR) (see Table 1).
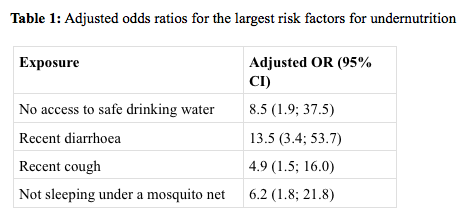
These findings suggest that access to safe drinking water and infection (i.e. diarrhoea, cough, malaria) are the probable main contributors to undernutrition in children in Abaya woreda (district). Contrary to expectations, agricultural factors such as land ownership, number of improved agricultural practices used, variety and type of crops grown, livestock holdings, number of income sources, etc. were not significantly associated with undernutrition.
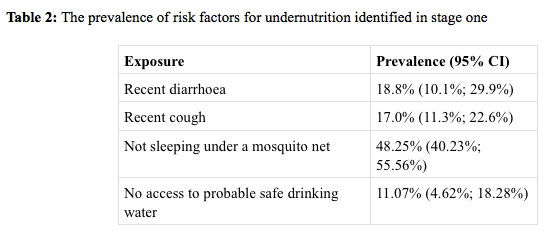
Stage two: Cross-sectional survey
A cross-sectional survey using rapid assessment method (RAM) was conducted immediately following the case-control study with the view to assessing the prevalence of risk factors for undernutrition identified in stage one (see Table 2).
Carers of 262 children from 16 garis (villages) in eight intervention kebeles (sub-districts) were interviewed. Four teams of two data collectors completed the RAM survey in five days. This was longer than anticipated, primarily due to market days and poor accessibility due to a combination of difficult terrain and heavy rainfall.
 Combining the information: Population attributable risk
OR is a good measure of effect but, when choosing the intervention that will have the biggest effect on the outcome, the prevalence of the risk factors in the population should also be considered. For example, an exposure strongly associated with the disease but of low prevalence in the population may cause fewer cases than an exposure that has a smaller effect but is more common in the population. PAR combines effect, size and prevalence of exposure to provide information that can inform prioritisation of interventions.
An estimate of the RR is required to calculate the PAR, but a case-control study provides estimates of the OR. It is possible to estimate risk ratios from cross-sectional survey data, but such a survey would be very expensive because it would require a very large sample size to provide sufficient statistical power to identify probable causes. When dealing with rare conditions such as SAM, the OR and RR are very similar to each other (Greenland & Robins, 1988), so our solution was to estimate RR from a case-control study by using SAM (i.e. a rare condition compared to GAM), so that the OR can be used to estimate the RR as a case-definition.
The information from the matched case-control study and the RAM survey were combined to calculate the PAR and estimate the proportion of SAM cases that might be prevented if the identified exposures were removed (see Box 1).
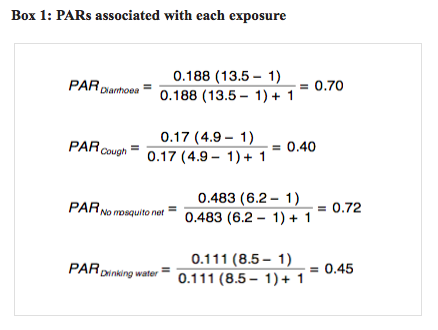
In our case, if the exposures diarrhoea, cough, not sleeping under a mosquito net and not drinking safe water were eliminated, up to 70%, 40%, 72% and 45% of SAM cases respectively could be avoided. This assumes complete elimination (i.e. 100% effective interventions delivered with 100% coverage). Such high levels of effectiveness and coverage are not usually achievable, so the PARs usually overestimate what can be achieved.
The maximum effect of the interventions eliminating all of the exposures can be estimated using a combined PAR. Summing the exposure-specific PARs often results in a combined PAR > 1. This is an impossible and meaningless value. The problem is that cases that could be avoided by removing either one or another exposure are counted more than once. The combined PAR indicating the proportion of undernutrition that can be attributed to all exposures is better estimated using a multiplicative model:
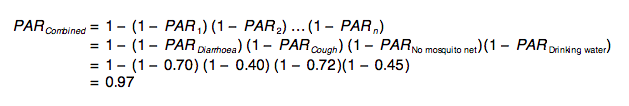 It is important to note that 0.97 (i.e. 97% of cases avoided) is the maximum effect of the interventions, given 100% effectiveness and 100% coverage. Partial elimination of the exposure may be modelled by varying the exposure parameter p in the PAR formula (see Box 2).
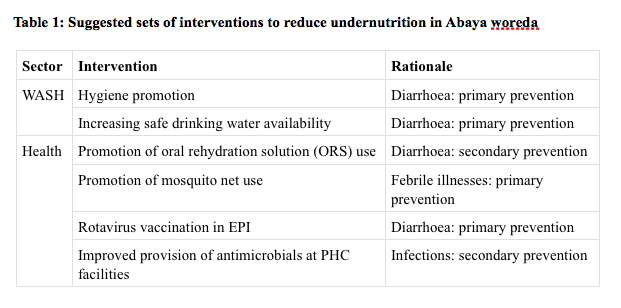
The combination of the resulting sets of information (i.e. strengths of probable causes of undernutrition and the prevalence of those causes) in the PAR allowed WV to identify a set of potentially impactful interventions to reduce undernutrition in Abaya woreda. This analysis suggests the sets of interventions listed in Table 1.
Discussion
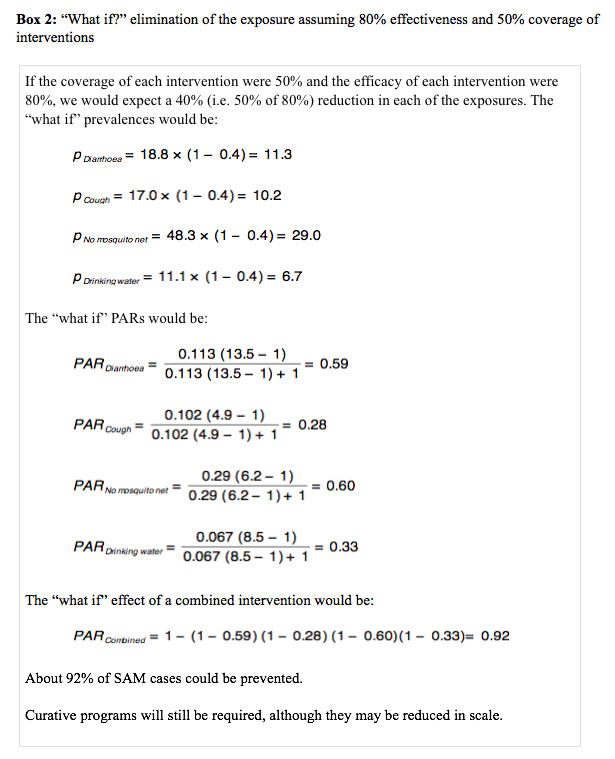
PARs can be ranked by likely effect of the intervention; effective and high coverage intervention against the exposure with the largest PAR will have the largest impact in reducing the incidence and prevalence of malnutrition. In Abaya, interventions targeting main causes of malnutrition (diarrhoea, cough, lack of mosquito nets and poor access to safe drinking water) could help to prevent 92% of SAM cases if they are 80% effective and have at least 50% coverage.
The advantage of this two-step approach to prioritising interventions is that it is relatively cheap, quick and identifies exposures associated with the most life-threatening form of undernutrition (SAM rather than MAM). The sample size required for a case-control study is considerably smaller than a sample size needed for a cross-sectional survey with the same statistical power. The survey can assess a small number of exposures and because the prevalence estimate does not need to be made with great precision, it can be done quickly and cheaply. A SMART survey could have been used instead of RAM; however due to limited time and financial resources, RAM was chosen as the preferred method because of its rapidity and lower cost.
This approach can be further tailored to address the needs of the organisation. Uncertainty can be incorporated by using the confidence intervals associated with the estimates of effect and prevalence of exposure. “What if?” scenarios can be modelled to explore the impact of incomplete coverage and efficacy of interventions and linear optimisation (linear programming) techniques can help with the selection of optimal sets of interventions. The information can feed into the programme management cycle and be used for designing and reviewing interventions. For organisations with limited resources, the ability to choose the most effective interventions that will achieve the greatest impact is particularly important. Further, combining this information with costs of interventions can provide good guidelines on what the intervention priorities should be and how resources can be used most efficiently in order to achieve the highest impact at the lowest cost.
For more information, email Katja Siling
References
Caulfield, L., de Onis, M., Blössner, M., & Black, R. (2004). Undernutrition as an underlying cause of child deaths associated with diarrhoea, pneumonia, malaria, and measles, American Society for Clinical Nutrition.
Greenland, S., & Robins, J. (1988). Conceptual problems in the definition and interpretation of attributable fractions. American Journal of Epidemiology, 128: 1185-1197.
Nwayo, M., & Myatt, M., (2012) Causal analysis and the SQUEAC toolbox, Field Exchange, 42: 37-38.
Ratnayake, R., Tesfai, C., & Myatt, M. (2013). Determining predictors for severe acute malnutrition: Causal analysis within a SQUEAC assessment in Chad, Field Exchange, 45: 23-25.
Ruel, M., & Alderman, H., (2013). The Maternal and Child Nutrition Study Group, Nutrition-sensitive interventions and programmes: How can they help to accelerate progress in improving maternal and child nutrition? The Lancet, 382: 536-551.
Tesfai, C., Ratnayake, R., & Myatt, M. (2013). Measuring local determinants of acute malnutrition in Chad: A Case-control Study, The Lancet, 38: S144.