
A multisector approach to monitoring planned and actual nutrition spending
By Amanda Pomeroy-Stevens, Alexis D’Agostino, Madhukar B Shrestha and Abel Muzoora
Amanda Pomeroy-Stevens is Research and Evaluation Advisor on the USAID-funded SPRING Project (JSI) and was principal investigator of the Pathways to Better Nutrition studies in Nepal and Uganda.
Alexis D’Agostino is a Monitoring and Evaluation Specialist with the USAID-funded SPRING project and was the quantitative analyst for the Pathways to Better Nutrition case study in Uganda.
Madhukar Bahadur Shrestha was co-principal investigator for the Pathways to Better Nutrition case study in Nepal.
Abel Muzoora was a research analyst on the Pathways to Better Nutrition case study in Uganda.
The authors thank Mr Ssansa Mugenyi, Ms Maureen Bakunzi and Mr Boaz Musiimenta from the Uganda Office of the Prime Minister and Professor Dr Geeta Bhakta Joshi, Mr Madhu Marasini, Mr Bishnu Nepal, Dr Yagya Karki and Mr Radha Krishnan Pradhan from the National Planning Commission for their kind support for this activity. They also acknowledge USAID for funding SPRING’s work on nutrition financing and are grateful to their technical partners Deutsche Stiftung Weltbevölkerung (DSW) for their work on the district budget data in Uganda. The authors also thank the stakeholders who participated in both studies for their time and feedback on the nutrition budget process.
Location: Nepal and Uganda
What we know: Transparent, routine and timely nutrition-financing data are needed to track country investment in nutrition.
What this article adds: SPRING has developed a methodology to analyse planned and actual spending for nutrition from a government perspective, including system diagnostics to inform future monitoring. It involves nine steps over three phases (collection, validation and analysis). The method was tested and refined in pilots in Uganda and Nepal. Challenges that required adjustments included: highly aggregated budget lines, lack of budget expertise among nutrition technical staff, lack of national-level data on central transfers to districts, off-budget data accessible only in NGO reporting databases, and variation between costing and budget exercises. Recommendations include exploring options to track nutrition activities such as cross-sector tracking codes or sector-specific budget lines and building budget analysis and advocacy into government training for nutrition staff. A global consultation involving the SUN Movement and others was convened to broaden learning. Next steps are to reassess emerging evidence and share recommendations more widely.
Introduction
Poor nutrition poses a great risk to the health and wealth of any country. Increased funding for nutrition is critical to address this. According to the 2014 Global Nutrition Report, every US dollar (USD) spent on reducing stunting provides a return of USD16 through increased development and improved health. However, recent estimates show that current financing available for nutrition is only about one third of what is needed to meet global targets (Shekar et al, 2016). Countries and partners must monitor nutrition financing to address funding shortfalls and develop country-specific investment goals. These data are surprisingly difficult to collect – they are not in just one sector and are often buried within existing budget structures (Lamstein et al, 2016). The 2016 Global Nutrition Report emphasised the need for more widely available and comprehensive data on nutrition spending, especially for indirect (or nutrition-sensitive) nutrition activities that can vary greatly from country to country.
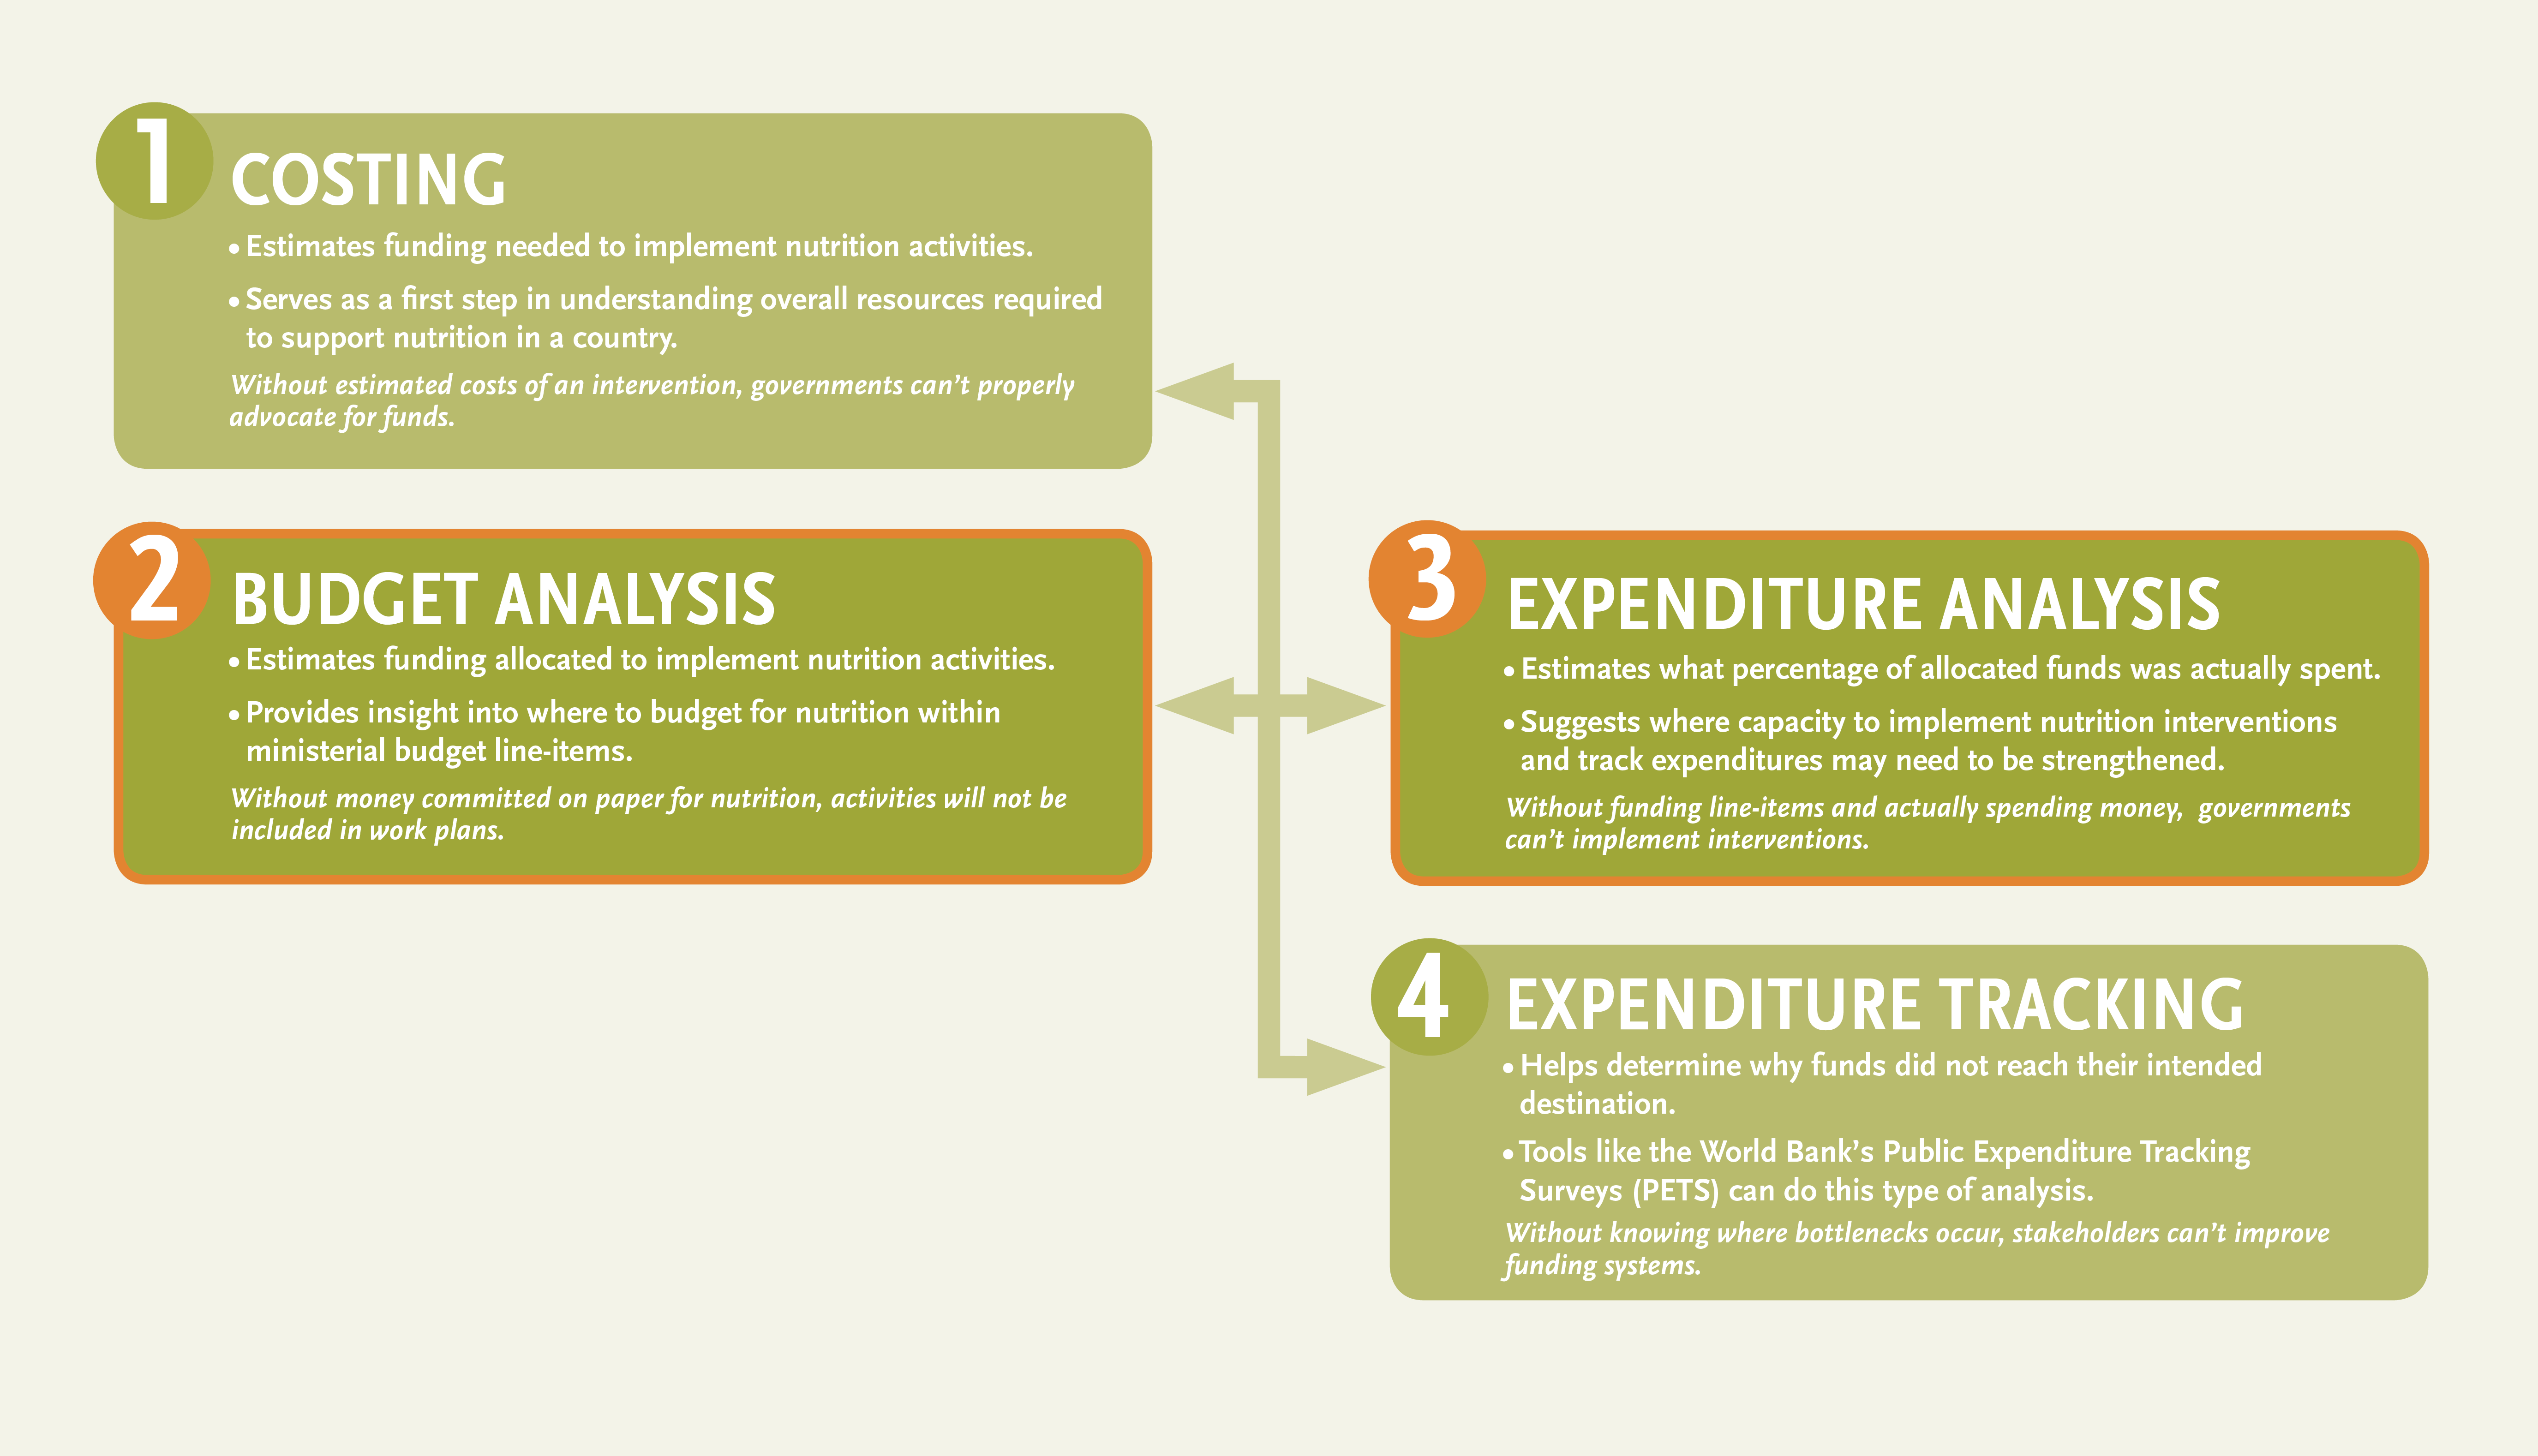
Several steps are needed to effectively measure and monitor financial support for nutrition at the country level (see Figure 1). While many governments have completed costing exercises for their National Nutrition Action Plans (NNAPs) (Step 1), fewer have completed the remaining steps outlined in this graphic. Steps 2 and 3 are related: budget allocations, or the amount officially approved to be spent, can be considered “planned spending,” while expenditures measure actual spending. Step 4 tracks the amount of financing that reaches the service delivery level. Countries that have started analysis have had to rely on primary data collection methods because of the lack of nutrition-related information in routine government systems. The Scaling Up Nutrition (SUN) Movement’s support for countries’ documentation of nutrition financing has improved documentation in this area; however to date only Guatemala and Peru have developed routine monitoring mechanisms for nutrition spending within their government systems (Victoria et al, 2016).
Figure 1. Steps to track financial support for nutrition
USAID’s SPRING project has developed an approach that countries can use to bridge the gap between primary data collection and developing more routine systems. Here, challenges faced in two countries are discussed, as well as adjustments made to overcome these challenges and how this information can strengthen efforts to create routine monitoring systems.
Methods
SPRING developed a methodology to analyse planned and actual spending for nutrition, with the goal of also providing system diagnostics to help move countries closer to routine monitoring of nutrition funding. The methodology is captured in SPRING’s budget analysis tool and guide for users.1
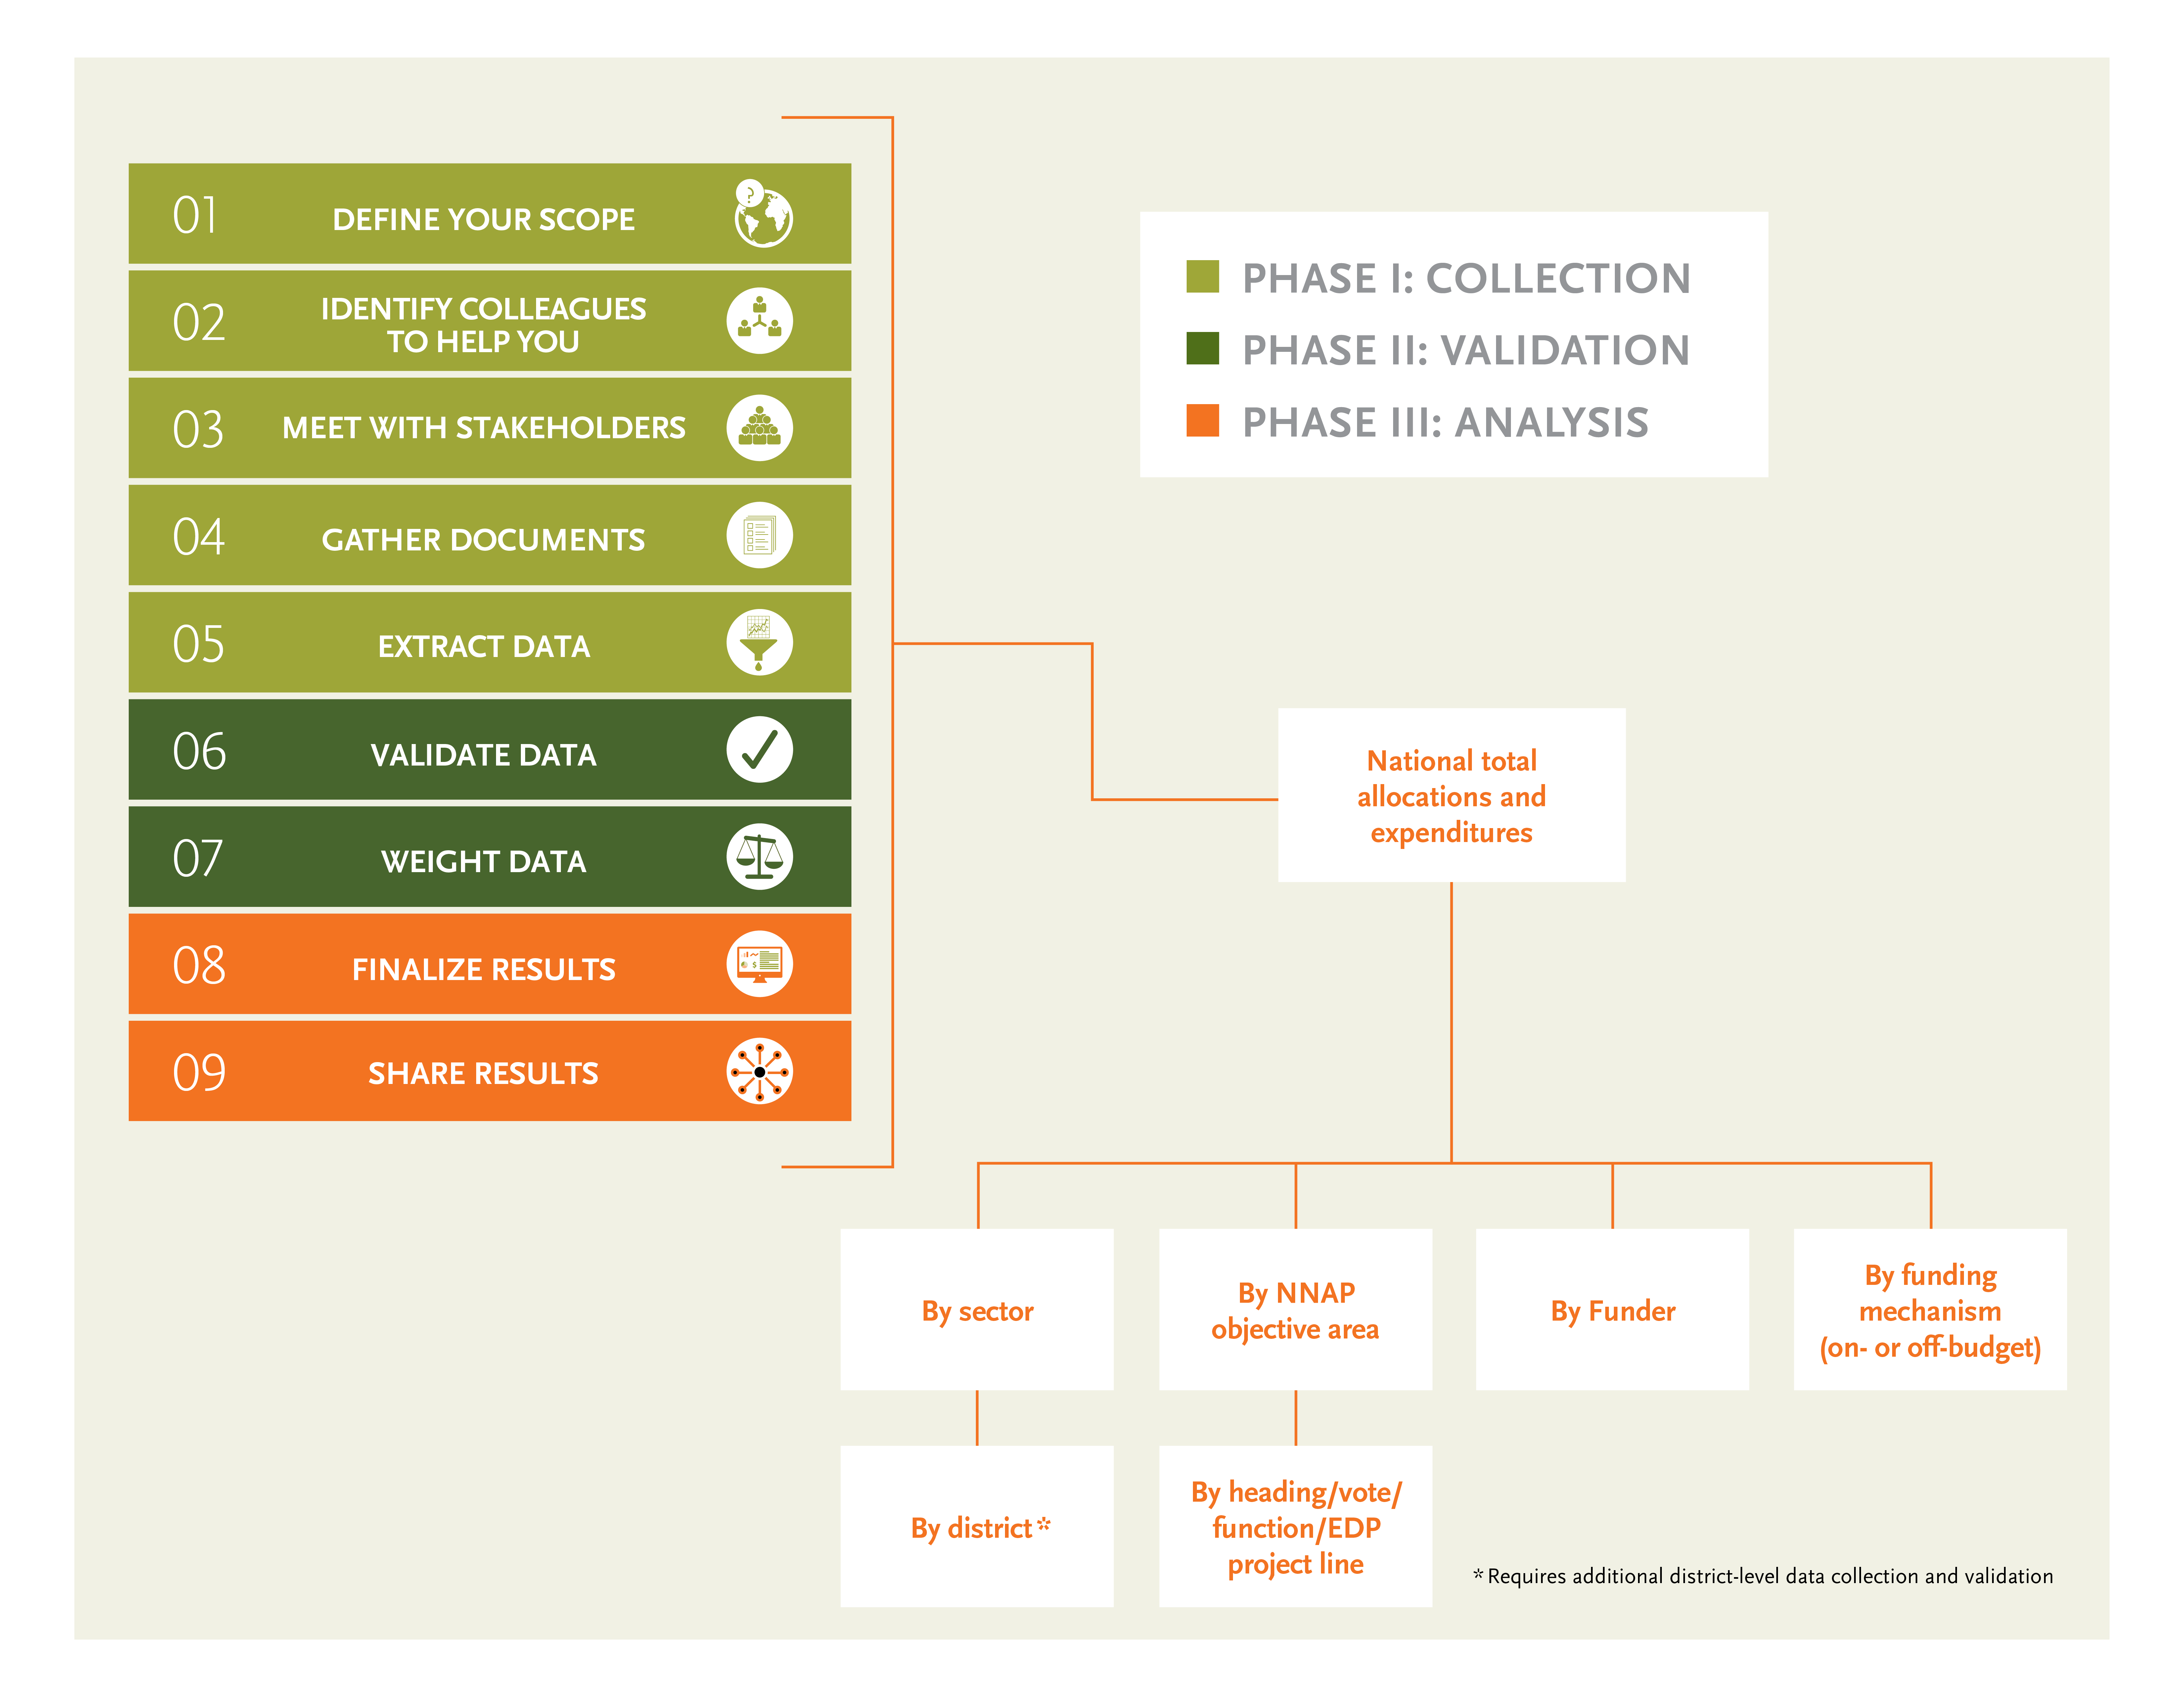
The government’s perspective was used to decide what to include as nutrition, using each country’s pre-defined NNAP activity lists (in Nepal’s Multi-Sector Nutrition Plan and the Uganda Nutrition Action Plan). This has the benefit of providing a clear mandate and justification for what nutrition actions to include in the analysis, but the drawback of reducing comparability of total estimates across countries. Official government data sources were prioritised where possible, both for on-budget and off-budget data. The final methodology includes nine steps over three phases: collection, validation and analysis, described in Figure 2. The benefits of this methodology are both its flexibility and utility as a diagnostic tool. It produces national estimates that can be divided by funding sources (government or external development partner (EDP)); financing mechanism (government budget (“on-budget”) or outside the budget (“off-budget”)); sector; or NNAP priority area. As a diagnostic tool, users will systematically uncover gaps in the documentation of budget data, identify which stakeholders are needed to support more routine nutrition financial tracking, and define the preferred format of data reporting.
Figure 2: SPRING’s budget tool methodology
Piloting of the methodology
SPRING tested and refined this methodology via the Pathways to Better Nutrition case studies in Uganda (2013–2015) and Nepal (2014–2016) (CABRI, 2008; Jelovac & Vandenindon (2008); MoFPED, 2013). These studies documented the enabling environment, including financing, for nutrition action in each country and provided an excellent opportunity to test this approach. The approach was also tested in two districts in Uganda, Kisoro and Lira. Collecting multiple years of data from both countries allowed us to refine the approach for the final tool.
Results
Several challenges were identified that required adjustments. Both Nepal and Uganda will need to systematically address these challenges to create more routine nutrition financial tracking.
Challenge #1: Highly aggregated budget line items
Often in nutrition we want to know how much has been spent on one particular nutrition activity, but budgets may not go into that level of detail. In Nepal and Uganda, the authors found highly aggregated budget “line items” – the lowest level of appropriations in a budget, that include many and varied activities – which made it difficult to identify specific nutrition activities. Frequently, little or no detail was provided in the budget on the type of activities included.
To complicate things further, in both cases more than 90% of nutrition-related activities were integrated into larger, non-nutrition line items. One example of an integrated line item from Nepal was the Integrated District Health Programme (IDHP) under the Ministry of Health (MoH), which included all types of nutrition activities, but also other non-nutrition health activities. Because of this, it was often impossible to get accurate estimates of funding down to the level of single nutrition activities.
Adjustment #1: Triangulating data sources during validation allowed for disaggregation of most integrated budget line items
To address this, the authors conducted validation meetings with a detailed interview guide to break apart budget line items. In the example of the IDHP item, interviewing the relevant budget officer at the Nepal MoH allowed the authors to obtain a sub-line item that showed that around 3% of the IDHP was nutrition-relevant. This percentage included various nutrition-specific (e.g., Integrated Management of Acute Malnutrition, Breastfeeding Week and vitamin A supplementation) and nutrition-sensitive (e.g., child cash grants, nutrition strategic planning and adolescent nutrition) activities. In another cases, for instance Uganda’s Food and Nutrition Security Surveillance programme, it was only possible to confirm that 100% was allocated to nutrition-relevant activities, with no further data on single-activity estimates. In the long-term, improving budgeting expertise among nutrition technical staff could make a more routine system of data reporting and validation possible.
Challenge #2: Lack of budget expertise among nutrition technical staff
The authors planned to fill all data gaps in the budget documents with input from the sector planning offices which house budgeting and financing staff and mobilise resources for each sector. However, it was difficult to identify appropriate budget officials when validating the data. In Nepal, most technical staff said they had fairly regular communication with their planning offices and could usually direct the research team to the appropriate planning officer for each item. In Nepal, planners provided either documentation or verbal breakdowns of the nutrition-related funding for 80% of the 40 line items identified. Planning offices in ministries newer to the national nutrition effort were less likely to be able to provide this information.
In Uganda, technical staff did not report strong existing connections to planners for their sector or district, resulting in fewer referrals for validation interviews. Only one validation interview was conducted for each of the seven ministries, covering 26 integrated line items in Uganda. This affected the accuracy of nutrition allocation and expenditure estimates; documentation or verbal breakdowns of nutrition-related funding were provided for only about 25% of items. Technical staff in a few sectors in Uganda also noted they had limited knowledge of the budget documents.
Adjustment #2: Training on budgeting for nutrition provided ministry staff with data-monitoring skills and an incentive to use nutrition-financing data
To address this challenge, and in response to requests from government officials in Uganda, SPRING worked with MoH officials and partners to train ministry staff on the Ugandan budget cycle, budget documents, advocacy points for nutrition funding and other topics. District officials in both Nepal and Uganda also requested this type of training to complement the ongoing NNAP-related nutrition trainings. These trainings have the potential not only to improve the reporting of nutrition-related financing, but also provide nutrition technical staff with more avenues to advocate for nutrition and could be adapted to include training on reporting in routine systems. SPRING’s tool can be used as the basis for these trainings.
Challenge #3: Lack of national-level data on central transfers to districts
Much of the money for district-level activities comes from ‘central transfers’, which are transfers of money from the national (central) government to sub-national bodies. These are usually ignored in estimates of national nutrition-related funding due to the way that they are documented within national budget documents, even though they form a substantial proportion of total funding. Provided by the national government, central transfers may be conditional (earmarked for particular activities) or unconditional (districts can spend them for any activity) and were accounted for differently in budget documents in Nepal and Uganda.
In Nepal, most conditional transfers were included in central government budget-line items for each sector, which meant that they could be validated just like any other national programme. This was also, generally, how EDPs funded off-budget, sub-national activities in both countries. Unconditional transfers, on the other hand, are not attached to any central-level activities and so could not be centrally validated. In Uganda, both types of central transfers were listed in highly aggregated budget-line items in separate volumes or sections of each sector’s Ministerial Policy Statements (MPS) and in the Ministry of Local Government (MoLG) MPS. For some years, no expenditure data for these line items were available. The only way to obtain accurate information on the nutrition-sensitivity of unconditional central transfers in both countries would be to collect data from each district.
Adjustment #3: Cross-referencing sub-national budget analysis to national documents helped create estimates of the contribution of central transfers to total nutrition financing
Budget data were examined in two representative districts in Uganda. From this, the authors could better understand central transfers and how they related to nutrition. Findings show that Kisoro received USD 0.5 million and Lira received USD 0.3 million in nutrition-related conditional central transfers and unconditional central grants for 2014–15 (Lukwago et al, 2016; Lukwago et al, 2016a). A simple, ‘back of the envelope’ extrapolation to expand these estimates to all districts would suggest that over 80% of all on-budget nutrition allocations in Uganda are some form of central transfer.
This exploratory exercise highlights how important it is to accurately track district-level nutrition funding. The estimated contribution of central transfers was substantial in both countries. If routine reporting of district spending were designed to feed directly into the national budget format, it would allow for national-level ministries to better estimate their total contribution to nutrition.
Challenge #4: Off-budget EDP data only available in non-governmental reporting databases
Funding that is not reported through the government budget (nor managed through the government treasury) can make up a large amount of total nutrition funding; for instance, many bilateral funders run their funds off-budget. Off-budget funding is done to speed implementation and ensure appropriate usage of funds and is carried out when absorption capacity of national financial systems is low, but because they are not reported through the official budget, it can be very difficult to find any records of these funds. Sifting through these data on a donor-by-donor basis is not possible – in both countries hundreds of potentially nutrition-related projects receive funding each year and in addition each donor may report on a different financial calendar than the government. Leaving out data on off-budget financing for nutrition would significantly underestimate the nutrition-related funding. While some funders are moving toward more on-budget reporting, this is still a major threat to the accuracy of both primary and routine data for nutrition budget analysis. Beyond nutrition, this issue has been recognised as a universal threat to aid transparency: the Busan Conference on Aid Effectiveness in 2011 (endorsed by 161 countries) set a maximum of 15% for off-budget aid as part of the ten national voluntary targets to be met by 2015. For comparison, SPRING found that about 51% of all EDP nutrition allocations were off-budget in Nepal, while 97% were off-budget in Uganda during the last year of analysis.
Adjustment #4: Use aid management platforms to track off-budget data
In both Nepal and Uganda, national policy dictates that EDPs should voluntarily self-report off-budget financing through the Ministries of Finance (MoF). Both MoFs have recently endorsed the use of an online, open-access aid management platform (AMP) to facilitate this reporting (Nepal in 2013, Uganda in 2014). Reporting aligns with the government fiscal year and donors report into the system quarterly. AMP templates vary by country, but most include commitments, disbursements and short project descriptions for each off-budget activity.
This approach worked well in Nepal, although the system was still being populated and refined during the time of this study. Since Uganda’s AMP was not available in 2013, the previous reporting structure had to be used, which was a paper-based report that did not include any disbursement data. In interviews, the MoF declared it did not have a set schedule for publishing these data, and the most recently released report was published in 2013. This provides a useful reference point for the improvements the AMP has made in transparency of these off-budget data. At the district level, off-budget data are even harder to find; for the analysis in Kisoro and Lira, the authors had to go to each individual donor or civil society organisation (CSO) working there to obtain these figures, which were often aligned to a different fiscal year and not always disaggregated to the district level.
While some issues of missing data still remain, SPRING found the AMP to be a major step forward in project-level financial reporting in these two countries. Until more aid funding can be reported through the official budget, efforts to create routine reporting for nutrition financing should consider linkages to AMPs.
Challenge #5: Variation between costing and budget methodologies
Comparing projected NNAP costs to spending can identify gaps in nutrition investment. The authors heard from key informants in both countries that spending (both planned and actual) was not always sufficient to cover NNAP activities each year. However, when the inflation-adjusted costs were compared to total allocation estimates for nutrition, both countries appeared to have allocated close to ten times more funding than the projected costs. This surprising result led us to look further at the comparability of costing and budget analysis methodologies.
NNAP costing exercises often use “bottom-up” methodologies that can underestimate overhead costs and efficiencies of scale. It was not possible to find full records on the costing methodology used in Uganda, but the Nepal documentation suggests that the costing excluded the existing personnel and facilities in some parts of their plan, but included them in others (Connolly, 2014; SUN, 2012; Pokharel et al, 2011). Conversely, all current budget estimations, including SPRING’s, rely on “top-down” methodologies that can overestimate input costs. The inclusion of EDP projects may have increased estimates further because of higher management and transaction costs for these projects. These differences may explain why it appears that current funding is more than sufficient to meet costs, despite key informant reports that funding is not sufficient.
Adjustment #5: Documentation of differences in methodologies
When presenting final results for Nepal and Uganda, the authors were careful to note potential differences in the methodologies. Because of this challenge, comparison of costs to allocations or expenditure were not included in the SPRING tool, even though there is high demand for this type of analysis. It would be resource-prohibitive to undertake a bottom-up NNAP expenditure analysis in most countries. Countries and partners need to keep these cost-spending comparisons in mind when they design the costing of any NNAP. Additional work is needed to better understand how to align budget tracking methodologies without causing an undue data collection burden and how to include these comparisons in any routine monitoring system.
Discussion
Transparent, routine and timely nutrition-financing data are needed at the country level. While countries must take the lead on monitoring nutrition financing, global actors can support development of budget-monitoring methodologies and increase local capacity.

SPRING’s approach provides funding estimates while also providing critical diagnostic information on current financial data on nutrition activities. The five primary challenges to data accuracy that were uncovered during piloting provide lessons on how to strengthen reporting. The authors offer the following recommendations to countries for future action to facilitate routine budget data collection:
- Explore the best options for tracking nutrition activities within the government budget. Some existing options include attaching cross-sector tracking codes to activities to make them easier to find within budgets (like those used for gender or climate change in Nepal) or creating a specific nutrition budget line in each sector for nutrition activities.
- Build budget analysis and advocacy into regular government NNAP training activities for all nutrition staff. This recommendation is equally relevant to EDP staff.
- Include reporting of district nutrition financing in regular district reporting systems, such as the output-based budgeting tool in Uganda.
- All EDPs should commit to following the 2011 goals and targets set for aid effectiveness, including timely reporting of financing (which can be done via the AMP) and eventually moving more EDP financing on-budget for greater transparency (Global Partnership for Effective Development Co-operation, 2013).
- Use budget estimates as a starting point for the next NNAP costing, then refine with bottom-up approaches. As regular tracking of unit expenditures improves, future budget estimates can also use a comparable mix of top-down and bottom-up approaches.
Change will not happen overnight but, if successful, these longer-term adjustments can reduce time and the cost of collection while increasing transparency, accountability and accuracy of nutrition-financing data.
The testing of this methodology was only done in two countries. There is a wide range of experiences in nutrition-budget monitoring, both globally and within countries, as outlined by the SUN Movement (2015) and the latest Global Nutrition Report. To broaden the learning base in this area, SPRING co-convened a global consultation with SUN, Results for Development, the Maximizing the Quality of Scaling Up Nutrition project, and others. This platform has been used to share country experiences in nutrition-budget monitoring and analysis, identify cross-cutting barriers and develop recommendations to overcome these barriers.
Next steps include reassessing guidance as new evidence emerges and sharing the recommendations more widely. The authors hope that the results of such efforts can help create an investment case for nutrition and improve the efficiency of spending on nutrition activities.
For more information, contact: Amanda Pomeroy-Stevens, amanda_pomeroy@jsi.com
1www.spring-nutrition.org/budget-tool
References
CABRI. Putting Aid on Budget. Synthesis Report. Centurion; South Africa: Collaborative Africa Budget Reform Initiative; 2008.
Connolly H. Learning from Efforts to Cost Country Plans: Priority Technical Issues to Address. Washington, D.C. : IFPRI; 2014.
Global Partnership for Effective Development Co-operation. Guide to the Monitoring Framework of the Global Partnership [Internet]. New York, NY: UNDP, OECD; 2013. http://effectivecooperation.org/
Jelovac I, Vandeninden F. How Should Donors Give Foreign Aid? Project Aid Versus Budget Support. Rochester, NY: Social Science Research Network; 2008 Apr. Report No.: ID 1139811.
Lamstein S, Pomeroy-Stevens A, Webb P, Kennedy E. Optimizing the Multi-Sectoral Nutrition Policy Cycle – A Systems Perspective. Food Nutr Bull. 2016;37: S107–S114.
Lukwago D, Tibesigwa D, Brucker M, Herbert M, Muzoora A, Adero N, et al. (2016) District Technical Brief: Report on Nutrition Financing in Kisoro District – 2013/2014 and 2014/15 Financial Years. Arlington, VA: Strengthening Partnerships, Results, and Innovations in Nutrition Globally (SPRING) Project; 2016 Jan.
Lukwago D, Tibesigwa D, Brucker M, Herbert M, Muzoora A, Adero N, et al. (2016a) District Technical Brief: Report on Nutrition Financing in Lira District – 2013/2014 and 2014/15 Financial Years. Arlington, VA: Strengthening Partnerships, Results, and Innovations in Nutrition Globally (SPRING) Project; 2016 Jan.
MoFPED. Report on Loans, Grants and Guarantees for Financial Year 2012/13. Kampala, Uganda: Government of Uganda; 2013.
Pokharel RK, Houston R, Harvey P, Bishwakarma R, Adhikari J, Pant KD, et al. Nepal Nutrition Assessment and Gap Analysis 2011. Kathmandu, Nepal: National Planning Commission (NPC),Ministry of Health and Population (MoHP); 2011 Mar.
Scaling Up Nutrition (SUN). Costing and Resource Mobilization for the Multi-Sectoral Plan: The Nepal Experience. SUN Focal Points Meeting; 2012 Sep 26; New York, NY.
Shekar M, Kakietek J, D’Alimonte M, Walters D, Rogers H, Dayton Eberwein J et al. Investing in Nutrition: The Foundation for Development: An Investment Framework to Reach the Global Nutrition Targets. Washington, D.C: World Bank, Results for Development, Bill and Melinda Gates Foundation, CIFF, Thousand Days; 2016.
Victoria P, Luna A, Velasquez J, Rios R, Gonzalez G, Knechtel W et al. Panel 7.1: Guatemala and Peru: Timely Access to Financial Data Makes a Difference in Actual Spending and Spurs Accountability at All Levels. Global Nutrition Report 2016: From Promise to Impact: Ending Malnutrition by 2030. Washington, DC: International Food Policy Research Institute; 2016. p. 83.