
Monitoring and evaluation of programmes in unstable populations: Experiences with the UNHCR Global SENS Database
By Melody Tondeur, Caroline Wilkinson, Valerie Gatchell, Tanya Khara and Mark Myatt
Mélody Tondeur is a former UNHCR consultant who now works with the Canadian Partnership for Women and Children's Health. She is a researcher and public health nutritionist, specialised in micronutrient malnutrition and emergency nutrition assessments with much field work experience in Africa.
Caroline Wilkinson is the Senior Nutrition Officer for the United Nations High Commission for Refugees (UNHCR) in Geneva and was fully involved in the development of the SENS and the introduction of mobile data collection in UNHCR SENS surveys. She previously worked for 14 years with Action Contre la Faim (ACF) in several countries and headquarters in Paris.
Valerie Gatchell is the Senior Nutrition and Food Security Officer for UNHCR in Geneva. She has 15 years’ experience working in nutrition programming with non-governmental organisations (NGOs) and United Nations (UN) agencies in both field and headquarter offices.
Tanya Khara is a public health nutritionist and currently one of the technical directors at ENN. She has 20 years of experience in nutrition programming in emergency and development contexts, and operational research with a number of NGOs, Valid International, UNICEF and the UK Department for International Development (DFID).
Mark Myatt is a Consultant Epidemiologist and Senior Research Fellow at the Division of Opthalmology, Institute of Opthalmology, University College London. His areas of expertise include infectious disease, nutrition and survey design.
This analysis of the UNHCR SENS database was made possible by funding from the UK Department for International Development (DFID).
The UNHCR data used in this article is part of the UNHCR Public Health Dataset. UNHCR does not warrant in any way the accuracy of the data or information reproduced from the data provided by them and may not be held liable for any loss caused by reliance on the accuracy or reliability thereof.
Location: Global
What we know: Monitoring and evaluation of nutrition programmes, including those for refugee populations, is routinely based on repeated cross-sectional surveys, comparing baseline and endline data on outcomes and process indicators.
What this article adds: In 2016 a formal analysis of the United Nations High Commission for Refugees (UNHCR) database of Standardised Expanded Nutrition Surveys (SENS) revealed shortcomings in the current approach. Current analyses are based on before and after cross-sectional surveys that assume that the populations surveyed are stable (births and deaths in balance and low migration). However, refugee populations are characterised by instability (due to new and temporary arrivals and exits) and therefore reduced prevalence and increased coverage cannot necessarily be attributed to programme change. New analytical approaches are needed that take instability into account. Analysis of time-series data that shows long-term trends and exceptions is ideal, but data are required over long periods with regularly spaced points (usually not possible in SENS surveys). A new procedure is proposed that involves fitting a LOWESS curve to the point estimates of indicator values (based on raw data; e.g. mid-upper arm circumference and weight-for-height z-score) using data provided by a single survey that compares values of individuals exposed and not exposed to an intervention. Visual analyses (box plots) and statistical analyses (Kruskal Wallis rank-summary test) are performed to interpret results. This approach still has limitations and more work is needed to test this method and develop new approaches.
Background
UNHCR and its partners have been collecting data on the health and nutrition status of refugees and related populations and nutrition programme coverage for many years. The method most frequently used is repeated cross-sectional surveys that follow the SMART model. The survey design is known as the Standardised Expanded Nutrition Survey (SENS) method. This is an expanded SMART survey that collects data for many indicators in areas including acute and chronic malnutrition; anaemia; diarrhoea; vitamin A supplementation; immunisation; infant and young child feeding (IYCF); food security; water, sanitation and hygiene (WASH); and long-lasting insecticidal bednets1.
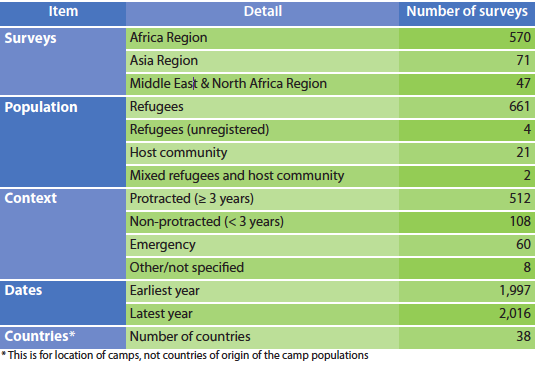
SENS surveys are used for needs assessment (prevalence indicators) and monitoring and evaluation (prevalence and coverage indicators). An effort to systematically collect survey reports and survey datasets for storage in a central repository started in 2009. By 2016 the global SENS database comprised of 688 survey reports and corresponding survey datasets covering populations in protracted crises (≥ 3 years), non-protracted crises (< 3 years), and emergency situations in 38 countries in the Africa, Asia and the Middle East and North Africa regions (see Table 1). The SENS database has been extensively used for ad hoc analyses. In 2016 a formal analysis of the available datasets was conducted for the first time to review country trends and inform future survey design and approaches to data analysis. This article describes some of the findings from the analysis, which suggest that traditional assumptions on monitoring and evaluation in refugee settings may need to be reviewed.
Table 1: The SENS survey database
 A common model of monitoring and evaluation
Monitoring and evaluation (M&E) of programmes is commonly based on repeated cross-sectional surveys which collect and report on outcome indicators (such as the prevalence of wasting) and process indicators (such as the period coverage of vitamin A supplementation). Seasonal effects are minimised by using surveys undertaken at the same time each year. Biases are kept constant by using the same design of survey, case definitions and data-handling methods for all surveys.
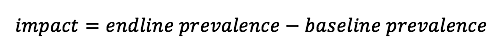
The simplest approach to monitor impact is to have baseline and endline surveys taken at the same time each year to control for seasonal effects (see Figure 1). Impact is evaluated as the change (i.e. the difference) in prevalence between baseline and endline:
For programmes running over many years, surveys of the same design are taken at the same time of year for each year that the programme runs (see Figure 2). Impact can be evaluated in a similar manner as with baseline and endline surveys:
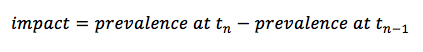
at each year, or as:
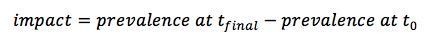
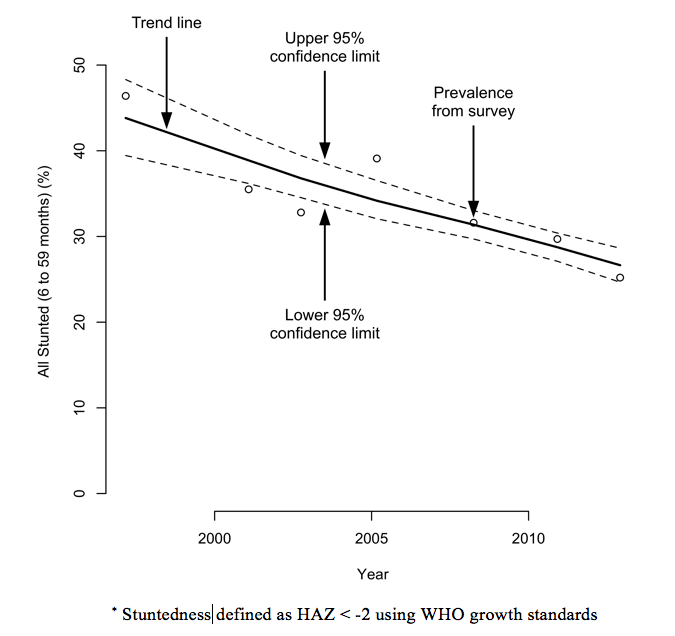
for the entire duration of programme. This sort of data may also be treated as a time series, as displayed in Figure 3 which shows the prevalence of stuntedness in four Algerian refugee camps between 1997 and 2012.
Figure 1: A simple baseline/endline evaluation
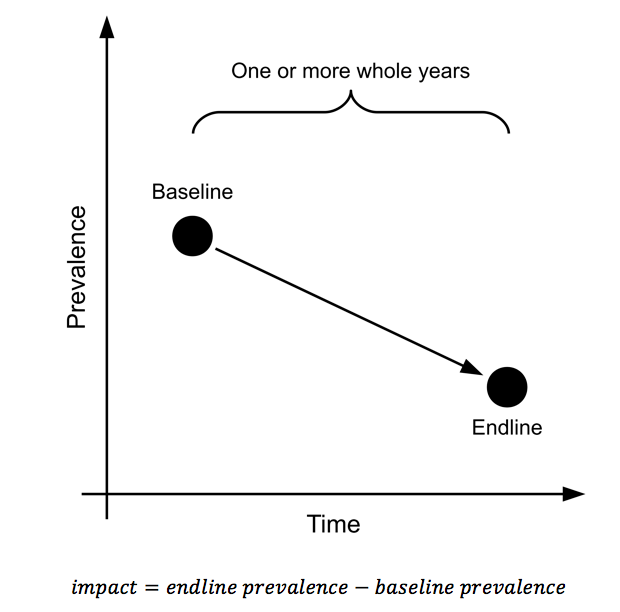
Figure 2: Evaluation over several years
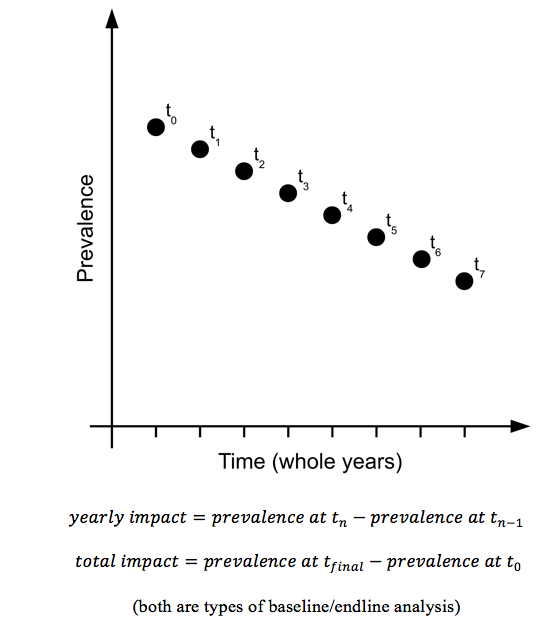
Figure 3: Prevalence of stuntedness in four Algerian refugee camps (1997-2012)*
The same approach can be applied to process monitoring (such as the monitoring of programme coverage); the difference being that the aim is to see coverage increasing over time and reaching and remaining above a critical minimum coverage standard, such as the SPHERE standards (www.sphereproject.org).
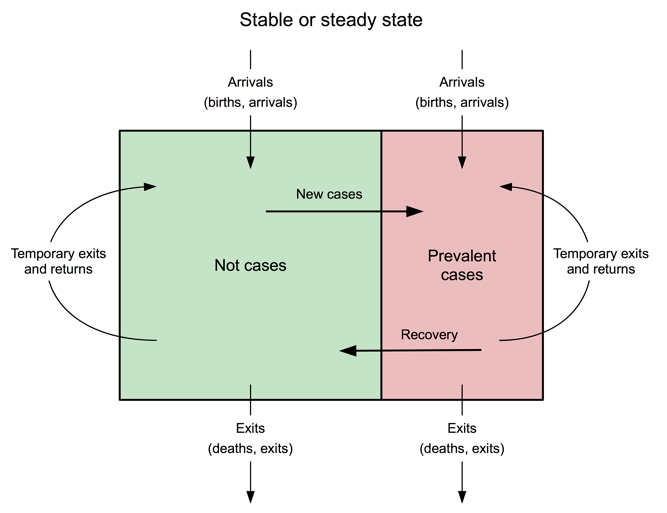
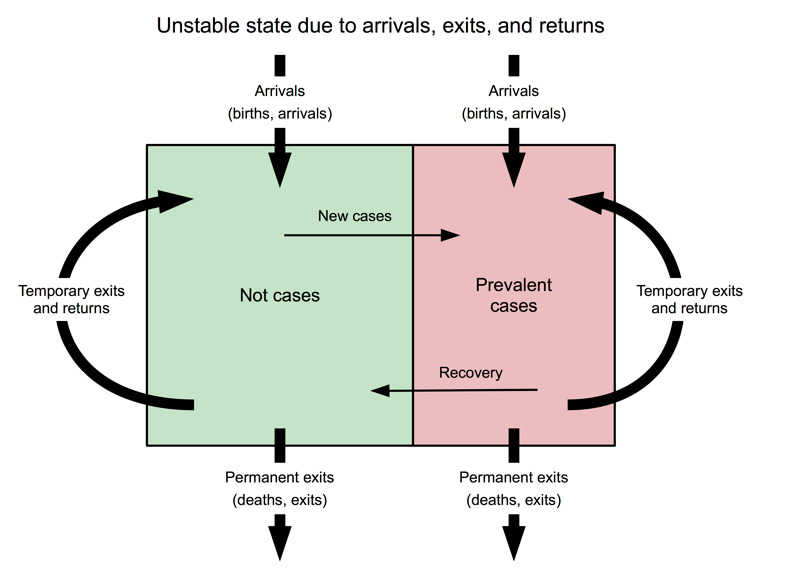
This approach to programme M&E makes some strong assumptions about the population in which a programme is being delivered, including that the population remains stable during the review period. In a stable or steady state population birth rates and death rates will be roughly in balance and there will be low levels of migration into and out of the programme area (see Figure 4). If these conditions are met then observed reductions in prevalence and observed increases in coverage may be attributed to programme activities.
Figure 4: Diagrammatic representation of a stable or steady state population
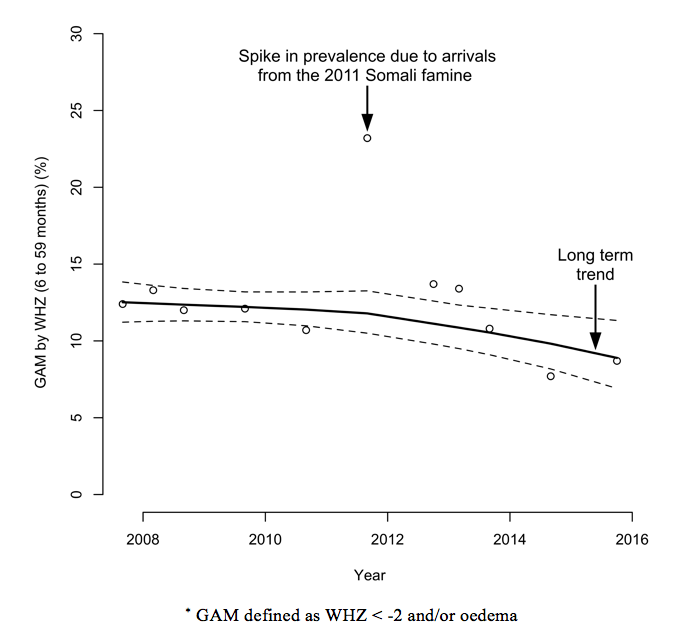
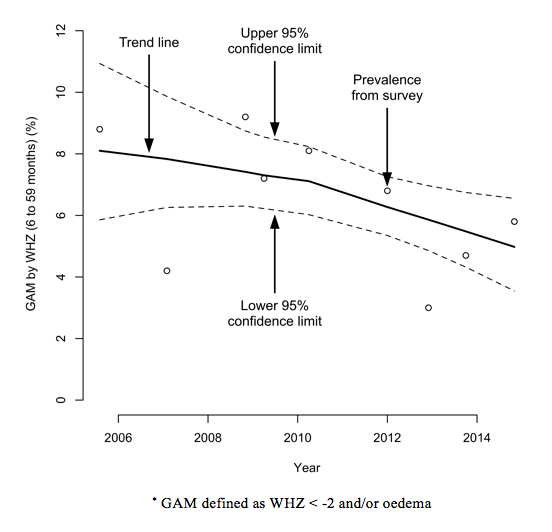
However, a steady state population cannot be relied on in a refugee context and the M&E approaches outlined above may yield misleading results. Instability may be due to new arrivals (see Figure 5) who increase the size of the population, may put pressure on services, and may degrade programme performance. There may also be increased prevalence and reduced coverage. Arrivals may also be more at risk than the rest of the population and may arrive in poor health, which will increase prevalence. Figure 6 shows the prevalence of global acute malnutrition (GAM), defined as WHZ < -2 and/or oedema, in the Dadaab-Dagahaley refugee camp in northern Kenya between 2007 and 2015. It shows how prevalence in a relatively stable population can be disrupted by new arrivals. The long-term trend was quickly re-established but this can only be seen in hindsight.
Figure 5: Diagrammatic representation of instability due to arrivals
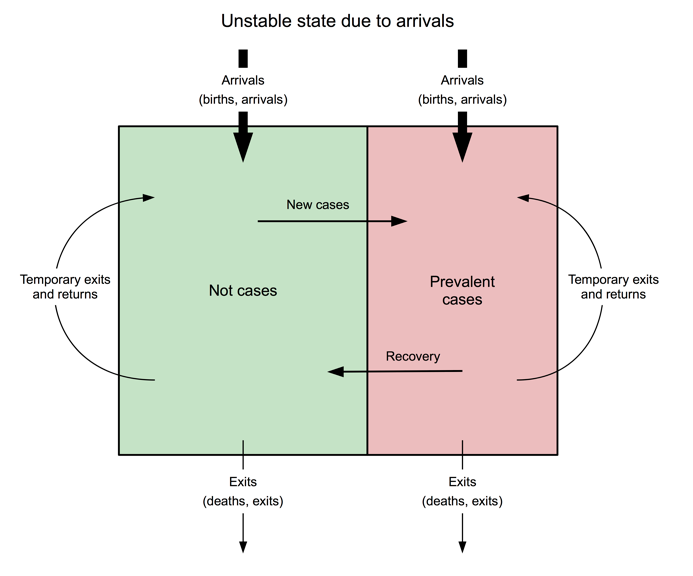
Figure 6: Prevalence of GAM in Dadaab-Dagahaley refugee camp (2007-2015)*
Instability may also be due to exits (see Figure 7), which have the immediate effect of decreasing the size of the population and other difficult-to-predict effects (such as a positive effect on coverage as pressure on services is reduced), or a negative effect on prevalence if the most at-risk and those in poor health remain. In refugee settings, large numbers of exits are often accompanied by restructuring of services, which can lead to short-term reductions or failures in coverage. In the Damak refugee camps in Nepal, for example, resettlement of refugees from seven camps led to the camp population dropping from 117,282 to about 23,059 between 2005 and 2014 and five of the original seven camps being closed (see Figure 8). Reports, surveys and key informant interviews indicate that the resettlement programme substantially changed camp dynamics and camp management became more challenging; those who were resettled more quickly had higher socioeconomic status than those remaining in the camps and households with children with health complications were slower to resettle. This may partially explain some of the observed deteriorations in indicator values. Resettlements and population movement due to camp closures and mergers appear to have led to considerable year-to-year variability in key indicators, including the prevalence of GAM (see Figure 9).
Figure 7: Diagrammatic representation of instability due to exits
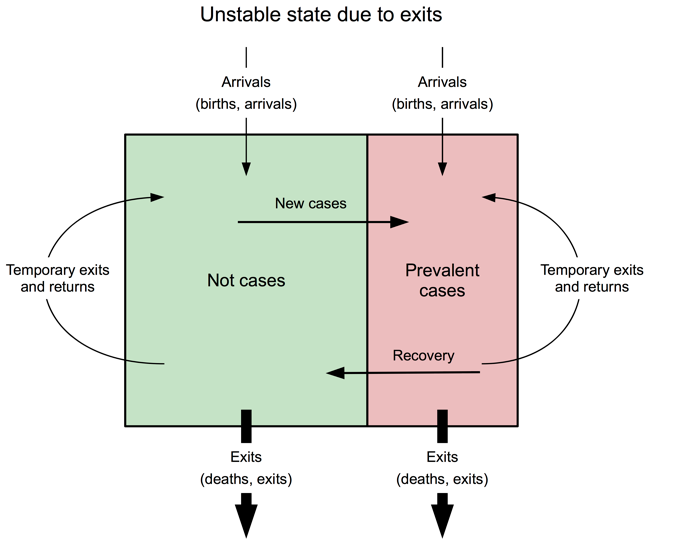 Figure 8: Population of Damak refugee camps in Nepal (2005-2014)
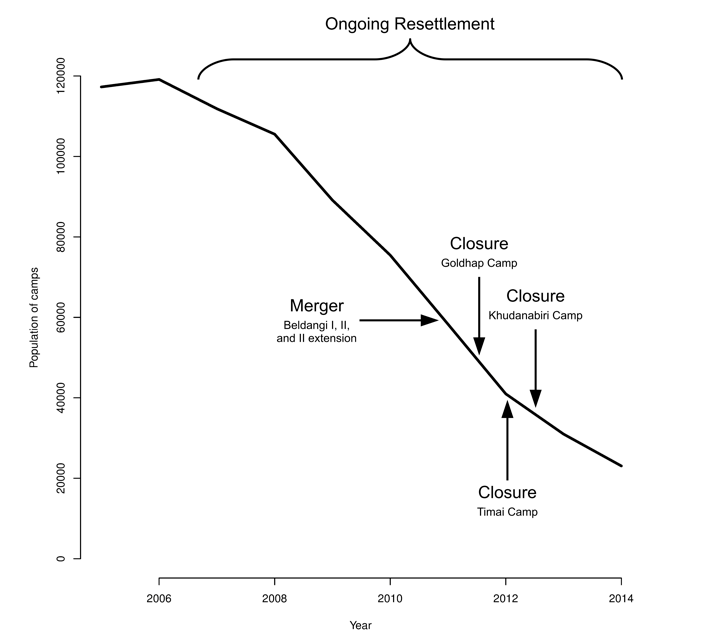 Figure 9: Prevalence of GAM in Damak refugee camps in Nepal (2005-2014)*
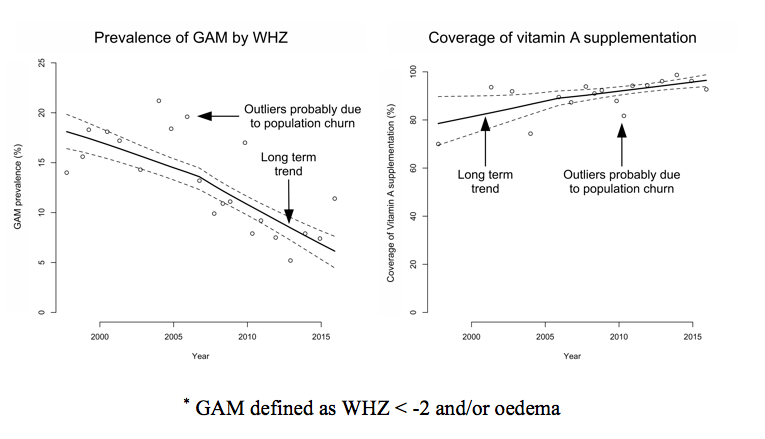
Instability may also be due to a combination of new arrivals and exits (see Figure 10) leading to a considerable turnover in population. Figure 11 shows the number of refugees and asylum seekers by county of origin for the Kakuma refugee camp in northwest Kenya between 2004 and 2017. Depending on the condition of arrivals and exits and the effect of fluctuations in the population on service delivery, this ‘churn’ can drive shifts in indicators away from long-term trends. Arrivals will often be in a poorer state than the existing camp population and/or exits; prevalence indicators will tend to go up and coverage indicators down. Despite this, the camp management and its partners in the Kakuma camp appear to have controlled prevalence, as well as achieving and sustaining high levels of programme coverage. Figure 12 shows the prevalence of GAM, defined as WHZ < -2 and/or oedema, and the six-month period coverage of vitamin A supplementation in the Kakuma camp in northwest Kenya between 1997 and 2015.
Figure 10: Diagrammatic representation of instability due to arrivals and exits
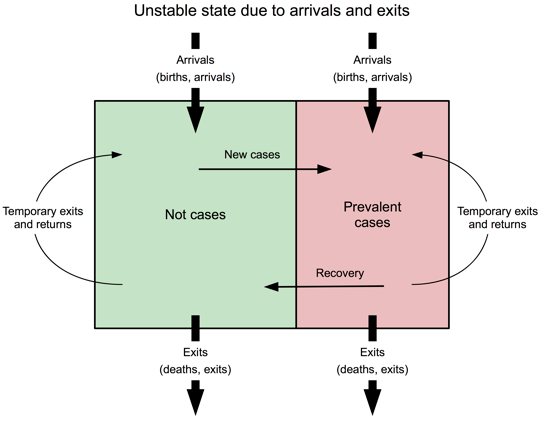 Figure 11: Number of refugees and asylum seekers by county of origin for the Kakuma refugee camp in northwest Kenya (2004-2017)
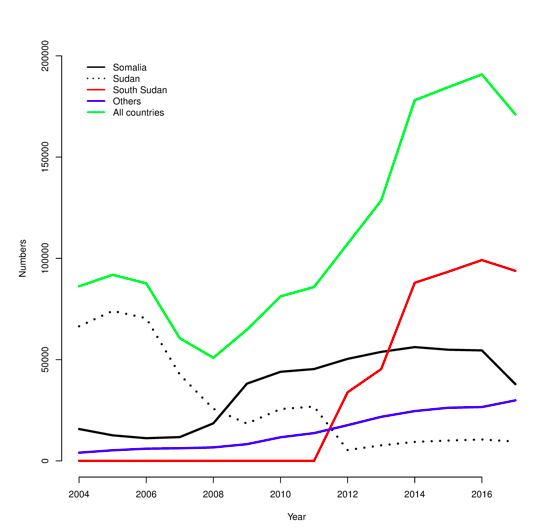 Figure 12: Prevalence of GAM by WHZ and the six-month period coverage of vitamin A supplementation in the Kakuma camp in northwest Kenya (1997-2015)*
An additional source of instability is temporary exits and returns, the consequences of which can be difficult to predict (see Figure 13). In cases where exits are household members leaving the camp to seek work with income accruing to the household in the camp, the effect will probably be to improve the condition of a portion of the camp population, which may be reflected in positive changes to outcome indicators. In other cases exits may have returned home but subsequently return to the camp, having fled worsening security. In this case there may be negative changes to outcome indicators. It is known that temporary exits and returns occur in all, or almost all, refugee camps. The numbers involved are, however, extremely difficult to monitor.
In examining the SENS database it was originally thought the baseline/endline model would apply. It became clear during data analysis and interpretation that, due to population instability, this model would not always apply. Alternative M&E strategies were needed.
Figure 13: Instability due to arrivals, exits and temporary exits and returns
Monitoring and evaluation strategies
The use of contextual information related to the nature of instability in the camp populations was first considered to help interpret results. However, it is often difficult to find a complete or near-complete set of useful information due to data not always being routinely collected and reported, data not being shared between partners, and some data being very difficult to collect (e.g. exits may be hidden to maintain access to rations and other benefits).
The analysis of data as a time series was found to be useful as it allowed the identification of long-term trends and their exceptions (as seen in Figures 6 and 12). However, this approach does not work with a single survey or a pair of surveys and large numbers (i.e. 20 or more surveys) are usually required. Few programmes last for 20 years or can provide 20 years of annual data (only one location out of 248 in the SENS database had over 20 data points), which makes this impossible to achieve.
Standard methods for the analysis of trends in times series assume regularly spaced data points, which was not always achieved in surveys in the UNHCR database. For example, in one setting (Ouri Cassoni in Chad) data were available from surveys conducted in July-August 2008, November 2009, October-December 2010, September-November 2011, January-March 2013, November 2014 and December 2015. The data points in this example are about 16, 12, 11, 16, 21, and 13 months apart and there is no data from 2012.
Standard methods for the analysis of trends in times series also do not tolerate ‘sparse data’ (i.e. data with missing values) very well, but in the SENS database the scope of surveys often changed over time, with some indicators being reported on an irregular basis.
The problems of shortness (i.e. few data points), irregularity and sparseness often occurred together. This limited the type of analysis that could be performed. Even a simple decomposition of a time series into, for example, trend, seasonal and noise (random) components using moving average models would not have been possible2.
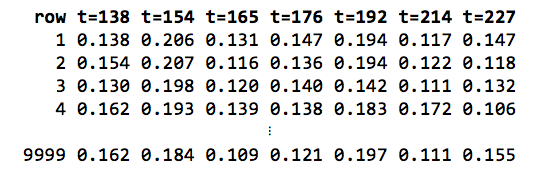
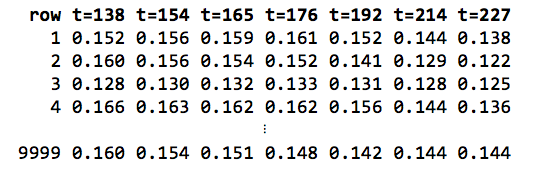
Given the limitations with the data, a non-standard data analysis procedure was used. This is described in Box 1 and Box 2. This procedure addresses issues with the SENS summary database (e.g. actual rather than effective sample sizes being reported) and provided 95 per cent confidence limits for trend lines. A very much simpler but still useful analysis could be performed by fitting a LOWESS (locally weighted scatterplot smoothing) curve just to the point estimates of indicator values (see Figure 14). LOWESS can work with short, irregular and sparse time series, but is of little use when there are very few (i.e. ≤ 5) data points. Another approach was tested that uses only the data provided by a single SENS survey. The approach assumes that interventions/programmes are evidence-based and very likely to have impact on the health of covered individuals and, if delivered with high coverage, will have impact on the population.
Box 1: The procedure used to work with short, irregular and sparse data
We analysed reported results (i.e. indicator values with 95% confidence limits) from the SENS summary database rather than raw survey data.
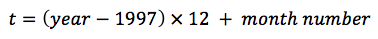
The earliest data point in the SENS summary database is in 1997. Time data (t) was recoded to month of data collection starting from January 1997:
For a single location you would use time from the first M&E survey.
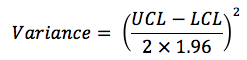
Indicator estimates and their associated confidence limits were expressed as proportions. The sampling distributions of each indicator at each data point were recreated from the indicator estimate (p) and the associated upper and lower 95% confidence limits (UCL and LCL). Variance was estimated as:
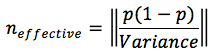
The effective sample size (n) was then estimated as:
This procedure addressed the issues of missing and unadjusted (i.e. for design effects) sample sizes. Adjustment for design effects was desirable because cluster samples often have smaller effective sample sizes than the number of children who are sampled.
The sampling distribution for each indicator at each time point was recreated as:
The recreated sampling distributions were resampled a large number (r = 9,999) of times. A matrix (M1) with r rows (where r is the number of resampled replicates used) and one column for each time point was produced. For example:
A LOWESS smoother with span = 1 (i.e. all data) and three ‘robustifying’ iterations were applied to each row of the matrix M1 to yield a second matrix (M2). The cells of this second matrix hold the LOWESS smoothed values for each row in matrix M1. For example:
The trend line consisted of per time-point estimates calculated as summaries of the columns of matrix M2. The central trend was calculated as the median of each column of matrix M2 and 95% confidence limits for the central trend calculated as the 2.5th and 97.5th percentiles of each column of matrix M2.
The LOWESS smoother is described in Box 2.
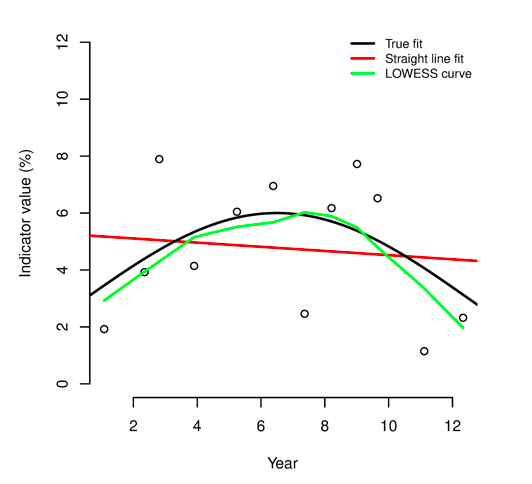
Box 2: The LOWESS smoother
LOWESS (locally weighted scatterplot smoothing)* is a form of regression analysis that draws a smooth line through a time-series plot or scatter plot to help identify trends or relationships between variables. The method copes well when noisy, irregular and sparse data make it difficult to discern a trend. The plot below shows how well LOWESS can identify a trend in data generated using a mathematical function (shown as ‘true fit’) that was then made noisy and irregular:
LOWESS is a non-parametric method for fitting a smooth curve to data points. A parametric method assumes that the data fits a given function. This can lead to fitting a curve or a line that misrepresents the data (as is the case with the ‘straight line fit’ in the plot shown above). Non-parametric smoothers like LOWESS try to find the curve of best fit without assuming the data must fit a particular function. In many cases, non-parametric smoothers are a good choice. This can be seen in the plot shown above.
* Many data-analysis systems provide functions to perform LOWESS smoothing. In some systems (e.g. SPSS) it is called ‘LOESS’. Microsoft Excel can do LOWESS smoothing using the XLSTAT add-in or the Peltier Tech Charts for Excel add-in. A free Excel add-in is also available. The RobustFit utility from the University of St. Andrews provides LOWESS smoothing. The Dataplot package from the US National Institute for Science and Technology also provides LOWESS smoothing. The analyses in this article were performed using the R language and environment for statistical computing.
Effectiveness was examined by looking at indicator values in individuals exposed and not exposed to an intervention. Using binary outcome indicators as the starting point, prevalence ratios were calculated:
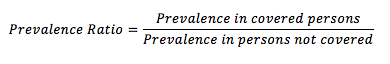
If the prevalence ratio (PR) is below one, there may be a positive effect on the outcome (i.e. the intervention is associated with reduced prevalence). If PR = 1, the intervention is not associated with the outcome. If PR >1, there may be a negative effect on the outcome (i.e. the intervention is associated with increased prevalence). There are problems with this approach. When prevalence is low (as is likely to be the case with severe acute malnutrition (SAM), severe anaemia and other severe conditions), there will be very few cases of the condition of interest. When coverage is high, there are will be few persons not exposed to the intervention. Low prevalence and high coverage together or singly reduce the statistical power of the analysis.
To overcome these problems the raw data (e.g. MUAC, WHZ) used to create the binary indicators were used. This approach provides more statistical power because the raw measurements contain more information than the binary indicators created from them. The problem of small numbers of cases was removed and the problem of small numbers in unexposed (i.e. not covered) groups due to high coverage reduced.
A combination of visual analyses (using box plots) and statistical analyses (using the Kruskal-Wallis rank-sum test) was used. Figure 15 shows an annotated box plot of haemoglobin (Hb, in g/dL) by vitamin A supplementation status from a SENS survey undertaken in Cox’s Bazaar in Bangladesh in March 2012. It is clear that children covered by the vitamin A supplementation programme tended to have higher Hb than children not covered by the vitamin A supplementation programme. The Kruskal-Wallis rank-sum test is a non-parametric, one-way analysis of variance that makes no assumptions (i.e. of normality and equal variance) about the distribution of data in the two groups. For the data shown in Figure 15, the median Hb was 11.5g/dL in the covered group (i.e. those reported as having received vitamin A supplementation in the previous six months) and 10.9g/dL in the not-covered group (p < 0.0001).
Figure 14: Example of a simple LOWESS plot
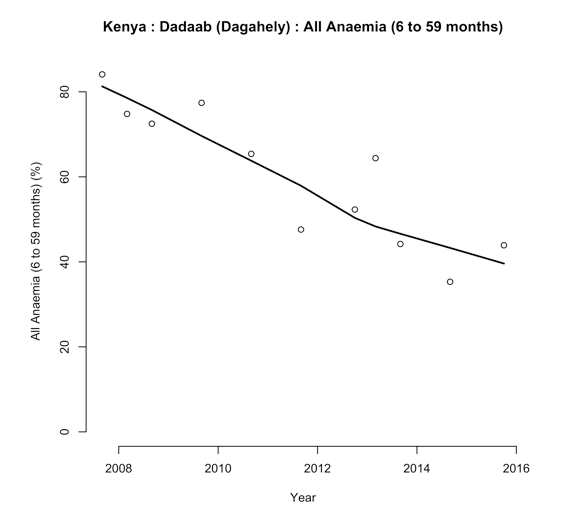 Figure 15: Box plot of haemoglobin by Vitamin A supplementation
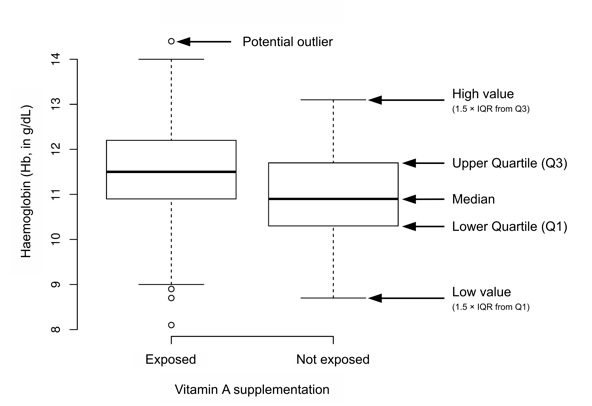
Both analyses suggest that the vitamin A supplementation programme was having a positive effect on Hb and the prevalence of anaemia. The coverage of vitamin A supplementation was 91.3% (95% CI = 85.7% - 96.9%). It can be concluded, therefore, that the vitamin A programme was being delivered with high coverage and was likely having a positive impact on Hb and the prevalence of anaemia, although progress was still to be made.
This was a useful approach but is not without problems. In settings with poor and/or patchy coverage the observed effect may be due to coverage being achieved in better-off groups of the population. The approach is also still susceptible to instability in camp populations. A negative finding such as deworming being associated with lower MUAC, for example, may be due to proper attention being paid to deworming new arrivals and less attention being paid to deworming existing camp residents.
Common sense needs to be applied when using this approach with targeted interventions. For example, an analysis of MUAC or WHZ by coverage of a targeted supplementary or therapeutic feeding programme is expected to show poorer anthropometric status in covered cases since these children are selected because they have low MUAC or low WHZ (or are at risk of developing low MUAC or low WHZ). This is not an issue with interventions that target specific age groups since these programmes are ‘blanket’ programmes for the target age groups. Analyses should, however, be limited to members of the target age groups.
Conclusions
Analysis of the SENS survey database was not as straightforward as originally envisaged. The simple baseline/endline analysis was not always appropriate due to instability in refugee populations and can, in unstable populations, yield misleading results. As a result, public health and nutrition interventions in refugee settings may be having a positive impact while prevalence remains high. A stubbornly high prevalence of GAM does not always mean that public health and nutrition programmes are failing but may be due to one or more forms of population instability. Examining and reporting individual effectiveness, as in the analysis relating to Figure 15, may prove useful in such settings.
In this study, simple analytical approaches have been devised that can be applied to the analysis of data from refugee situations to avoid problems described. Work is needed to further examine these issues and test, develop or replace these methods, which are likely to have broad applicability.
Endnotes
1Details of the set of indicators entered into the UNHCR Global SENS Database at headquarters are available on request.
2The use of moving averages with more regular time series is covered in the FANTA SQUEAC/SLEAC technical reference: www.fantaproject.org/monitoring-and-evaluation/squeac-sleac