
Implementation of nutrition surveys using SMART methodology in sub-Saharan Africa
By Jana Daher, Fanny Cassard, Sara Gari, Victoria Sauveplane-Stirling, Mara Nyawo and Patrick Codjia
Jana Daher is the SMART Project Officer at Action Against Hunger Canada. She is a nutritionist, public health professional and epidemiologist with extensive international experience in managing and evaluating programmes and research projects.
Fanny Cassard is an independent nutrition consultant whose main expertise is the implementation of nutrition surveys using SMART and SENS methodologies. She has ten years’ experience in doing surveys at small-scale and national level with Action Against Hunger, UNICEF and UNHCR.
Sara Gari is a research, monitoring and evaluation specialist with over ten years’ experience in nutrition and health programmes in both humanitarian and development contexts, including with UNICEF West and Central Africa Regional Office as the regional nutrition monitoring and surveillance specialist.
Victoria Sauveplane-Stirling is the former Senior Program Manager at Action Against Hunger Canada, where she led the Global SMART Initiative to enhance the quality and timeliness of nutrition data for decision-making purposes.
Mara Nyawo is a nutrition specialist with UNICEF Eastern and Southern Africa Regional Office. She is a public health nutritionist with over 15 years’ experience in humanitarian and development contexts in sub-Saharan Africa.
Patrick Codjia is the Chief of Nutrition for UNICEF Kenya. Prior to this he worked for UNICEF Eastern and Southern Africa Regional Office and UNICEF Country Offices in Malawi, Democratic Republic of Congo and Botswana on both development and emergency nutrition programmes.
The authors would like to thank UNICEF Country Offices, government and non-governmental organisation partners and counterparts in the countries included in this review for their support in providing contextual information and reports to enable the review.
The findings, interpretations and conclusions in this article are those of the authors. They do not necessarily represent the views of UNICEF, its executive directors, or the countries that they represent and should not be attributed to them.
Location: Sub-Saharan Africa
What we know: SMART Methodology (field survey method) is widely used in sub-Saharan Africa by governments and partners at national, sub-national and lower level in nutrition surveillance and early warning systems.
What this article adds: A recent UNICEF/Action Against Hunger review examined the implementation of SMART surveys across sub-Saharan Africa (45 countries) and the factors that have facilitated their institutionalisation. Thirty-two countries had implemented SMART surveys. Regional differences exist; annual national nutrition surveys in West and Central Africa help reach a consensus on an individual country’s nutrition situation; in East Africa, sub-national surveys driven by emergencies are more typical. Average costs are US$21,1000 (national surveys) US$15,050 (small-scale surveys). Good government buy-in through the process, quick data analysis turnaround and strong communication and advocacy with coordination systems are key to realising added value. Areas for improvement include mapping of capacity-development needs, harmonising timing for data collection and tools, and examination of frequency of small-scale surveys to facilitate sustainability. Further research needs include a systematic review of the quality of SMART surveys.
Introduction
The SMART (Standardised Monitoring and Assessment of Relief and Transitions) Methodology1 is a standardised, simplified, cross-sectional field survey method designed to aid the collection of quality, up-to-date and timely nutrition data necessary for decision-making. The methodology was developed to harmonise methods for nutrition assessments, especially during emergencies. Today, national health ministries and partners such as international non-governmental organisations (NGOs) and United Nations (UN) agencies use the SMART Methodology to conduct nutrition surveys in both emergency and development contexts.
This use of the methodology illustrates the need for regular, reliable data for nutrition indicators at national level to track progress towards global targets. Across West and Central Africa (WCA), the first National Nutrition Surveys (NNS) using the SMART methodology were conducted in Niger and Mauritania in 2006 and have since been conducted in 15 more countries2, largely driven by UNICEF with support from Action Against Hunger. Sub-national or smaller-scale (county/district-level) SMART nutrition surveys have also been implemented in WCA countries, including Cameroon and the Democratic Republic of Congo (DRC). In contrast, in Eastern and Southern Africa (ESA), the SMART methodology has generally been used for sub-national and smaller-scale nutrition surveys, with the first NNS conducted in 2014 in Tanzania.
After over a decade of implementing SMART nutrition surveys across sub-Saharan Africa, a review of key processes, steps and tools used to implement the different types of SMART survey (national, sub-national and small-scale) was carried out, under a partnership cooperation agreement between UNICEF WCA and ESA Regional Offices and Action Against Hunger Canada between November 2015 and May 2016. Its primary objective was to document lessons learned and highlight shortcomings related to planning and implementation processes of SMART surveys in various sub-Saharan African countries, including coordination mechanisms, implementation and use of results. In addition, the implementation of the first SMART NNS in Tanzania and the institutionalisation of SMART NNS in Burkina Faso were examined in more detail.
Methods
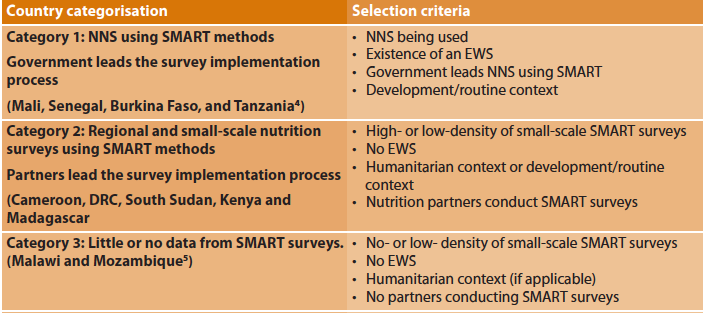
All 45 countries across UNICEF ESA and WCA regions were considered for this review. Countries were classified into three categories (Table 1), based on their national information systems. Using data compiled by UNICEF WCA and ESA offices between 2013 and 2015, this included the type of SMART survey conducted (national, small-scale or none); frequency and density of SMART survey (“low” meaning 1-10 SMART surveys conducted annually; “high” meaning > 10 SMART surveys conducted annually); existence of an early warning system (EWS); and key partners in their implementation. Two main uses of SMART surveys were identified: humanitarian crises (when a SMART survey is conducted in response to a specific crisis situation and is carried out to provide guidance on the allocation of resources and emergency programmes); and in a development context (when a SMART survey regularly contributes data to nutrition surveillance systems).
For each of the three categories, a minimum of two countries with different characteristics were chosen to make up the representative sample of 11 countries (Table 1). Secondary data analysis was undertaken in the first half of 2016. UNICEF’s regional offices3 shared all documents related to SMART surveys conducted between 2013 and 2015, including schedules, budgets, tools and final reports. Additional information on implementation processes were collected from key informants directly involved in SMART surveys at country level via emails, teleconferences, meetings and interviews.
Table 1: Summary of selection criteria and country categorisation
Findings
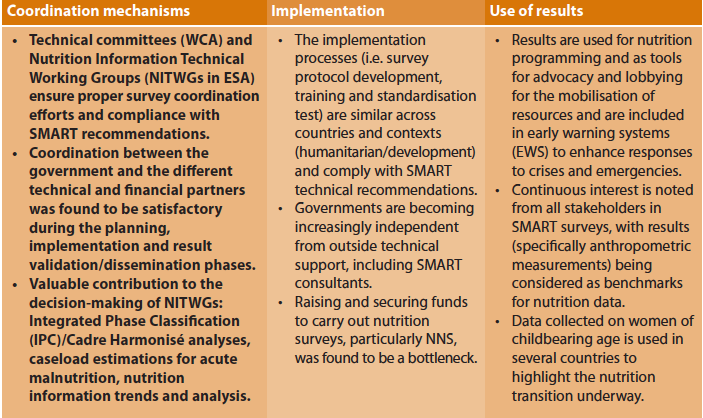
SMART Methodology is widely used in sub-Saharan Africa by governments and partners to conduct timely nutrition surveys in all contexts and on a regular basis, often coinciding with seasonal variations, at national, sub-national and smaller-scale levels. The review found that 32 out of 45 countries had implemented SMART surveys between 2013 and 2015, contributing to the harmonisation of nutrition rapid assessment methods across the region. The use of NNS led by governments also contributed to achieving consensus on the national nutritional situation in nine countries6 between 2013 and 2015. Further process-specific findings based on the sample of 11 countries are listed in Table 2.
Table 2: Process-specific findings
In terms of differences between survey coordination and implementation in WCA and ESA, NNS in WCA are conducted annually to reach a consensus on the country’s nutrition situation; these are coordinated and implemented by a technical committee that includes members of government (such as the Ministry of Health (MoH) and the Bureau of Statistics) as well as technical and financial partners (mainly international donors via UN agencies and sometimes governments).
The primary role of the technical committee is to develop and validate the survey protocol, advise on steps to ensure the conduct of a high-quality survey, provide support during the entire training and data collection process (technically and logistically) and validate survey results. Capacity-building of these technical committees started almost a decade ago; for example, in 2009 in Burkina Faso. Since then, the MoH in Burkina Faso committed to strengthening nutrition interventions in health services and in the community within the framework of its 2010-2015 strategic nutrition plan. This included a nutrition situation surveillance mechanism supported by annual NNS conducted since 2009 by the MoH Department of Nutrition, with the process taking on average six months to complete (six weeks for planning and four and a half months for implementation). The regular technical support from UNICEF WCARO7 and the ongoing capacity-building through regional SMART methodology trainings have ensured a successful institutionalisation of the capacity required to conduct these annual surveys.
In ESA on the other hand, sub-national and smaller-scale SMART surveys are more widely implemented, driven by the emergency monitoring needs in the region. Surveys are coordinated by a Nutrition Information Technical Working Group (NITWG) or equivalent at country level that has a similar composition and responsibilities to the technical committees in WCA.
By 2015, Tanzania was the only country in ESA to implement an NNS using the SMART Methodology. Following a year of coordinated advocacy efforts to the Government and nutrition partners, this first NNS was planned and implemented between July and December 2014. Led by the Ministry of Health and Social Welfare (MoHSW) and the Zanzibar MoH in partnership with key stakeholders, it was conducted in response to the need for an additional source of reliable data between rounds of Demographic and Health Surveys (DHS), which are conducted every four to five years. The purpose was to ensure a closer monitoring of key nutrition indicators required to track progress towards global targets and to inform development of a new National Nutrition Action Plan.
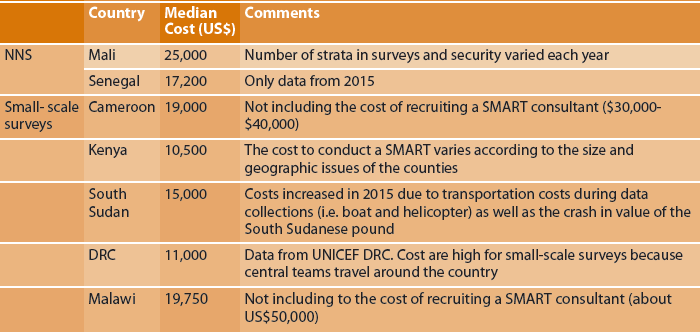
To assess cost differences between small-scale and national-level surveys, the overall cost per survey8 was divided by the total number of strata (each of the smallest non-overlapping sub-groups in which the total population is divided during a survey and for which malnutrition estimates are obtained). This allowed comparison between national (multi-strata) and small scale (single stratum) surveys. The results showed that the average cost per strata in national surveys was US$21,100, compared to US$15,050 for small-scale surveys (see Table 3). Insecurity significantly increased survey costs, such as in the regions of Gao and Kidal in Mali. Data on cost were not available for all surveys.
Table 3: Cost per strata in different countries in US$
The results of SMART surveys across ESA and WCA are incorporated into various national and regional nutrition information systems and/or EWS, including FEWS NET, Cadre Harmonisé (Harmonised Framework), Integrated food security Phase Classification (IPC) and Nutrition Information in Crisis Situations (NICS).
The regular implementation of NNS has often led to a consensus on the country’s nutritional status, making it possible to respond to and evaluate the response to different food and nutrition crises that may have affected the country in recent years, enhance nutrition information and EWS, bolster the position of nutrition within the government, and monitor the progress of global nutrition indicators (including those of the Scaling Up Nutrition (SUN) Movement and the Millennium Development Goals (MDGs).
In Burkina Faso, for example, an analysis of results incorporated into the National Health Information System from multiple NNS showed a downward trend in the malnutrition rates over the past five years and an improvement in infant and young child feeding (IYCF) indicators since 2012.
Lessons learned
The involvement of the government throughout the different survey phases and its ownership of survey results, the short turnaround time from data collection to reporting (less than four months in the case of Tanzania) and the effective communication ensured by the established coordination mechanisms were identified as key attributes of the added value of NNS. The main driving factor leading to a government’s ownership of the survey and its results was the advocacy process using NNS results to plan nutrition programming, especially since the outcomes were considered as benchmarks by the technical and financial partners. For example, the results of the first NNS in Tanzania were used to identify priority regions, improve nutrition programming and prepare the National Multisector Nutrition Action Plan (2016-2021), which aimed to achieve the 2025 World Health Organization (WHO) targets for nutrition. The results of annual NNS conducted by the Government of Burkina Faso were used to regularly update indicators and continuously monitor the country’s nutrition situation.
Recommendations
Several areas for improvement were identified in this review:
- Only two out of the 11 selected countries (Kenya and South Sudan) scheduled regular SMART Survey Manager training sessions. It is advisable to develop a mapping of existing capacities and a training plan to address sustainable capacity-development needs.
- The timing of data collection differed throughout the years in some countries implementing NNS, limiting comparison between years (due to the bias effect of the seasonality of malnutrition). It is recommended that data are collected during the same period (ideally during the “hunger season”) to allow for comparison with past surveys and the capability to intervene quickly in case the nutritional situation deteriorates sharply.
- Toolkits guiding the NNS implementation process have been developed in many countries that conduct NNS. There is a need to conduct a comparative assessment of these tools in order to harmonise them and develop a standardised toolbox for the implementation of NNS.
- The frequency and representation of regional and/or small-scale surveys and the cost-benefit and need for data should be carefully considered in each country context to reduce associated implementation costs and thereby facilitate the sustainability of the information systems currently in place.
Limitations and further areas of research
This review faced some limitations, including:
- The purposeful sampling and the small sample size of 11 countries out of a total of 45 sub-Saharan countries might limit the generalisability of results (the sample of countries with different implementation profiles can, however, be considered sufficient to document the SMART implementation process).
- The review focused on the use of SMART surveys and did not look at other forms of nutritional surveillance that may be employed by different countries (this was beyond the scope of the review).
- The SMART survey implementation process and the lessons learnt derived from shared documents and secondary information dating between 2013 and 2015 were described narratively rather than generated using more complex statistical analyses.
- Given that detailed information was not gathered on the profile of existing national nutrition information systems, an analysis of nutrition information systems was not included in this review.
Further areas of research recommended following this review include:
- Large studies with complex analyses are needed to better inform stakeholders on the role that SMART survey results play in national nutrition information systems, nutrition advocacy, policy development and nutrition programming.
- A systematic review of the quality of SMART surveys and lessons learned on how to improve data quality would be useful to inform data-quality improvement efforts for other surveys that collect nutrition indicators.
For more information please contact Mara Nyawo.
Endnotes
1For more information on SMART (Standardized Monitoring and Assessment of Relief and Transitions): http://smartmethodology.org/
2Burkina Faso, Central African Republic, Gambia, Guinea, Mali, Mauritania, Nigeria, Niger, Senegal, Sierra Leone, Togo, Guinea Bissau, Ivory Coast, Chad and Liberia.
3UNICEF West and Central Africa Regional Office (WCARO) and UNICEF Eastern and Southern Africa Regional Office (ESARO).
4Case study for Tanzania and Burkina Faso available at http://smartmethodology.org/about-smart/
5Since 2015 (outside of the time frame for this study) regular surveys using SMART have been carried out in both Malawi and Mozambique at sub-national levels.
6Burkina Faso, Chad, Mali, Mauritania, Niger, Nigeria, Senegal, Sierra Leone and Tanzania
7UNICEF West and Central Africa Regional Office.
8For the surveys shown in Table 3. Cost data was not available for all surveys.