
Is there a systematic bias in estimates of programme coverage returned by SQUEAC coverage assessments?
By Mark Myatt and Ernest Gueverra
Mark Myatt is a consultant epidemiologist. His areas of expertise include infectious disease, nutrition and survey design. He worked with FANTA, Valid International, the US Centers for Disease Control and Prevention, Tufts University, Action Against Hunger UK, Concern Worldwide and the Coverage Monitoring Network as the lead developer of the SQUEAC coverage assessment method.
Ernest Guevarra leads Valid International’s coverage assessment and surveys team. He has formal training as a physician and a public health practitioner. Most recently he has worked in Sierra Leone, Niger, Sudan, Ethiopia and Ghana. He is the lead developer of SQUEAC, SLEAC and S3M coverage assessment methods at Valid International.
Location: Global
What we know: Used since 2012, the Semi-Quantitative Evaluation of Access and Coverage (SQUEAC) coverage assessment method employs both qualitative and quantitative methods to identify key barriers to access and estimate coverage of therapeutic feeding programmes (TFP) and, to a lesser extent, supplementary feeding programmes (SFP).
What this article adds: A recent article by Isanaka et al (2018) on SQUEAC implementation in Niger suggests that the analysis required is technically demanding and in part relies on subjective estimates of programme coverage. With typical operational capacities this will cause SQUEAC assessments to systematically overestimate coverage. This article investigates the risk of systematic bias by analysing a database of 304 SQUEAC coverage assessment reports and data from 29 countries (2009-2017). There is a tendency for the ‘prior’ (an informed guess about programme coverage) to overestimate coverage when the true coverage is low and underestimate coverage when the true coverage is high. There is an equal risk of the prior overestimating and underestimating coverage (i.e. no systematic bias). Problems were detected in 7.3% of the SQUEAC assessments reviewed but this led to coverage estimates with poor precision in only 2.25% of assessments. The use of untrained staff and failure to use SQUEAC processes, methods and tools correctly is likely to increase this risk. The authors conclude there is no evidence of general and systematic overestimation of coverage using SQUEAC and that the risk of the method yielding estimates with poor precision is low. A key lesson from the Isanaka et al (2018) SQUEAC experience is the importance of using both properly trained staff and using SQUEAC processes, methods and tools correctly.
Background
A recent article by Isanaka et al (2018) (summarised in Box 1) identifies a potentially serious problem with coverage estimates made using the semi-quantitative evaluation of access and coverage (SQUEAC) method. Coverage estimates made by SQUEAC rely on condensing data collected from a variety of sources using a range of methods to make an informed guess about the level of coverage a programme is achieving. This informed guess is known as the prior. The prior is used to inform the design of a small-sample coverage survey. The prior is also combined with coverage survey data, known as the likelihood, to provide an estimate of the coverage that a programme is achieving using a widely accepted statistical technique known as conjugate analysis. A problem with this approach is that a very poorly specified prior can result in a biased estimate of coverage. A prior that is much higher than the true coverage can lead to an upwardly biased estimate of coverage. A prior that is much lower than the true coverage can lead to a downwardly biased estimate of coverage. These situations are known as prior-likelihood conflicts. If a priorlikelihood conflict is detected, the results of the conjugate analysis are discarded and a coverage estimate is made using the survey data alone. This estimate will not be biased but may lack precision (i.e. have a wide 95% credible interval), due to the small sample size used in the coverage survey. The article by Isanaka et al (2018) identifies prior-likelihood conflicts as a weakness of the SQUEAC coverage assessment method which leads the method to systematically overestimate programme coverage.
The issue of prior-likelihood conflicts is not new. It is covered at some length in the SQUEAC technical reference (Myatt et al, 2012). A formal test for prior-likelihood conflicts has been provided by the BayesSQUEAC calculator since 2013 (Myatt, 2013). The specific case of untrained staff producing an unrealistically optimistic and overly strong prior, as reported in the article by Isanaka et al (2018), is presented as a case study in the SQUEAC technical reference. The article by Isanaka et al (2018) confirms the existence of a problem that is frankly admitted, discussed and cautioned against in SQUEAC documentation and training. This should not, however, prevent us from taking this criticism of the SQUEAC method very seriously. It is possible that there is a serious problem with the SQUEAC method which is leading to a general and systematic failure to identify programmes failing to meet coverage standards and leaving many vulnerable children untreated. This issue is investigated in this article.
Method
A database was created from SQUEAC coverage assessment reports and SQUEAC coverage assessment data provided by the Coverage Monitoring Network and VALID International. Reports and data for n = 304 SQUEAC coverage assessments from 29 countries undertaken between 2009 and 2017 were available. Only data from SQUEAC coverage assessments which completed a SQUEAC stage III coverage estimation survey (n = 274) are included in the analysis reported here.
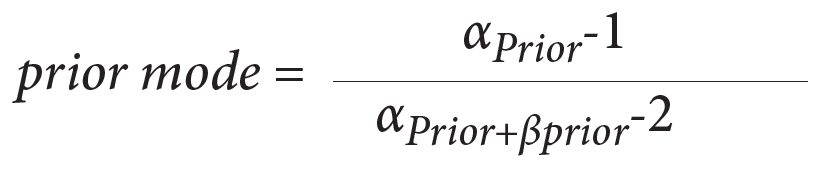
For each SQUEAC coverage assessment, the mode of the prior was calculated as:
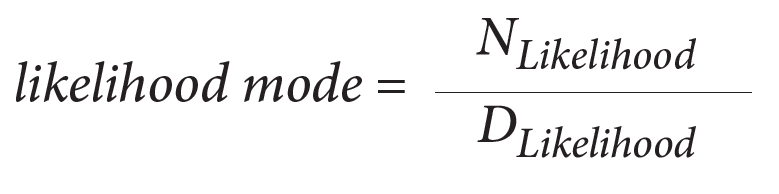
The numerator (NLikelihood) and denominator (DLikelihood) for the likelihood mode were calculated for the principal coverage estimator (i.e. point, period, or single coverage) reported in the SQUEAC coverage assessment report:
This was the estimator for which the original prior was developed. Testing a prior intended for estimating point coverage for conflict with a likelihood estimate for single coverage would, for example, not be sensible or fair test and almost always result in a prior-likelihood conflict. The analysis followed, therefore, the intentions of the coverage assessment teams.
The relationship between the prior modes and the likelihood modes was explored by calculating, plotting, and summarising the difference:
and by plotting the prior modes against the likelihood modes.
The strength of the linear association between the prior modes and the likelihood modes was assessed using the Pearson correlation coefficient. Ordinary least squares linear regression was used to determine the slope of the line that best described the relationship between the prior modes and the likelihood modes.
For each SQUEAC coverage assessment, prior-likelihood conflicts were detected using a testing approach. Two-by-two tables were constructed with cells:
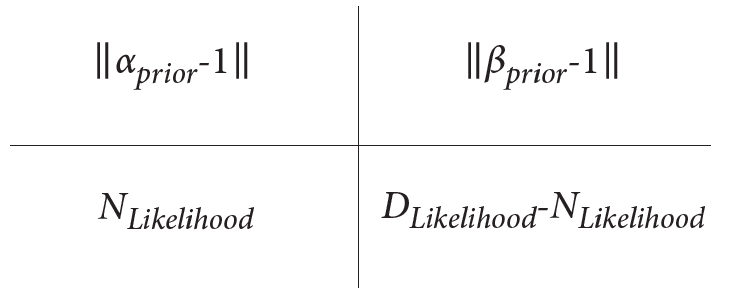
and Fisher’s exact test of independence calculated for each of the constructed tables. Fisher’s exact test was used to avoid issues with small sample sizes and very unequal distribution of data within tables giving rise to small expected numbers, which would be problematic if approximate methods such as the normal (z) test and the chi-squared test were used. A two-sided p-value of p < 0.05 was taken as evidence of a prior-likelihood conflict.
The half-width of 95% confidence intervals (E) for the likelihood modes (p) were calculated using the normal approximation and applying a finite population correction (i.e. because severe acute malnutrition is a rare condition) for each SQUEAC coverage assessment for which a priorlikelihood conflict was detected:
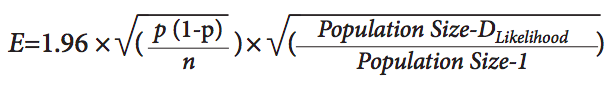
The population size used to calculate the finite population correction (i.e. 600) was calculated assuming an overall population of 100,000 persons with 20% aged between 6 and 59 months and a 3% prevalence of severe acute malnutrition (SAM). These are conservative assumptions. It was not necessary to use the prevalence of moderate acute malnutrition (MAM) to calculate the finite population correction as no prior-likelihood conflicts were found in assessments of supplementary feeding programmes (SFP).
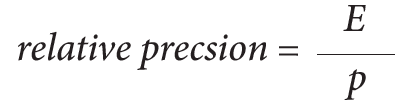
The relative precision achieved using the likelihood data alone was calculated as:
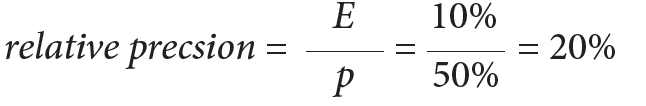
A coverage estimate of 50% (p) with a 95% confidence interval of ± 10% (E) has relative precision:
The resulting relative precision was compared to the relative precision that would have been achieved by a standard Expanded Program of Immunisation (EPI) ‘30 x 7’ coverage survey with the same point estimate of the coverage proportion (p), a sample size of n = 210 and a survey design effect of 2.0. This relative precision was used as the ‘gold standard’ for the precision of methods assessing the coverage of child survival programmes. A SQUEAC assessment was classified as ‘failing’ if a prior-likelihood conflict was detected and the relative precision of the coverage estimate made using the likelihood data alone was worse than this gold standard.
Results
Table 1 presents a description of the study database. Figure 1 shows the distribution of the differences between the prior modes and likelihood modes. The median difference was −0.97% (IQR = −8.31%; +8.39%). The differences were normally distributed (Shapiro-Wilk Normality Test p = 0.6287) about a central value close to zero (mean = −0.67%, 95% CI = −2.25%; +0.90%).
Figure 2 shows the scatterplot of prior modes against likelihood modes. Prior modes and likelihood modes were positively associated with each other. Pearson’s correlation coefficient was r = 0.73 (95% CI = 0.67; 0.78). This is very strong evidence (p < 0.0001) against the null hypothesis that prior modes and likelihood modes are not associated with each other. The slope of the regression line was β = 0.55 (95% CI = 0.49; 0.61).
Figure 1: Distribution of the differences between the prior modes and likelihood modes in 274 SQUEAC stage III coverage assessments
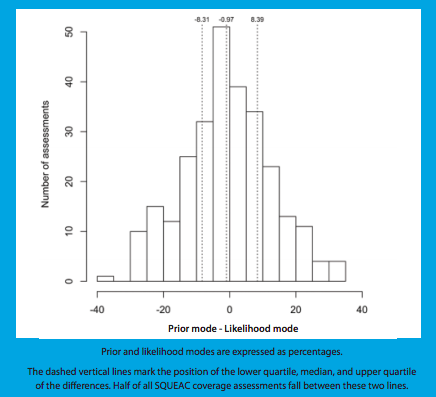
Figure 2: Scatterplot of prior modes against likelihood modes in 274 SQUEAC stage III coverage assessments
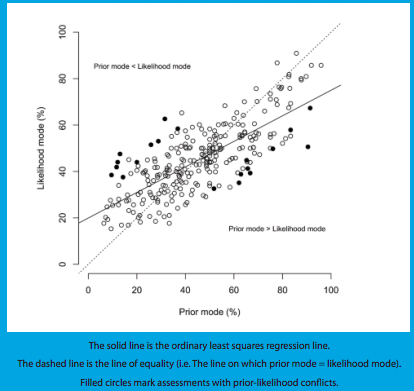
Prior-likelihood conflicts were detected in 20 (7.30%) of the 274 SQUEAC assessments. In 10 SQUEAC assessments with prior-likelihood conflicts the prior mode was below the likelihood mode. In 10 SQUEAC assessments with prior-likelihood conflicts the prior mode was above the likelihood mode (see Figure 2). The relative precision of coverage estimates based on likelihood data alone was worse than that which would have been achieved by the EPI-derived gold-standard in seven of the 20 SQUEAC assessments with prior-likelihood conflicts. This means that seven (2.55%) of the 274 SQUEAC assessments were classified as failing due to prior-likelihood conflicts and an inadequate sample size for the likelihood data to estimate coverage with useful precision.
Table 1: The study database
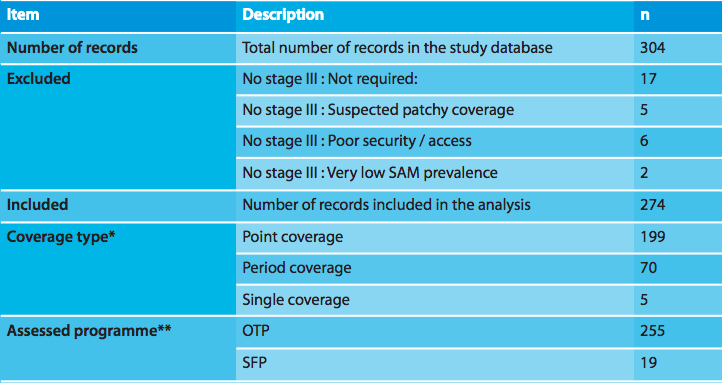
* Point coverage measures case-finding and recruitment; period coverage measures case-finding, recruitment and retention but overestimates coverage; single coverage adjusts period coverage, removing bias by including an estimate of the number of recovering cases in the community in the denominator. The estimator used by the original coverage assessment team was used in the analysis reported here.
Discussion
The magnitude of Pearson’s correlation coefficient (r = 0.73. 95% CI = 0.67; 0.78) might be typified as indicating only a moderately strong association. It is, however, unrealistic to expect a stronger association between informed guesses (i.e. prior modes) and estimates (i.e. likelihood modes) made using small sample likelihood data. The nature of the prior mode (i.e. an informed guess) and the likelihood mode (i.e. an estimate made using a small sample size subject to considerable sampling variation) makes finding a stronger association between them extremely unlikely.
The distribution of differences between the prior mode was symmetrical about a central value. This is not consistent with a systematic bias (in either direction) in prior modes. There is a tendency for the prior to overestimate coverage when true coverage is low and to underestimate coverage when true coverage is high. Prior-likelihood conflicts followed this pattern. Prior-likelihood conflicts were detected in 7.30% of the 274 SQUEAC assessments but led to coverage estimates with poor precision in only 2.25% of the 274 SQUEAC assessments. Prior-likelihood conflicts in which the prior mode was below the likelihood mode were equally as common as prior-likelihood conflicts in which the prior mode was above the likelihood mode. These findings indicate that there is no general and systematic failure in SQUEAC.
There is an important lesson to be learned from the Isanaka et al (2018) article. The SQUEAC assessment reported in the article was not done well. This is noted in the discussion section of the article. There is no evidence of the use of standard SQUEAC tools and practices such as triangulation by source and method, sampling to redundancy, iteration, the barriers-boostersquestions (BBQ) tool, small studies and surveys, mind-maps, and concept maps. The resolution of conflicting findings by further data collection (iteration) is a key SQUEAC process that was not used. The article states that iteration was not done even when it was indicated. Finding a wide range of candidates for the prior mode, as is reported in the article, should have forced a rethink and further data collection (iteration). The sources for the problematic prior modes were unorthodox. SQUEAC does use caregivers and community members to identify and rank barriers to coverage, but these informants are never tasked with responsibility for building the prior. A weak or noninformative prior should always be used with such a wide range of candidates for the prior mode when time and resources for iteration are not available.
A key but understated finding reported by Isanaka et al (2018) was that the prior developed by trained staff was unproblematic. The lesson to be learned is that you risk bias when you do SQUEAC with untrained staff, use inappropriate sources and do not use key SQUEAC processes, methods and tools.
Conclusion
Prior-likelihood conflicts can and do occur but seldom result in coverage estimates that lack useful precision. They do not lead to a general and systematic overestimation of coverage. The work of Isanaka et al (2018) demonstrates the importance of using trained staff and using SQUEAC processes, methods and tools correctly.
Box 1 : Estimating programme coverage in the treatment of SAM: A comparative analysis of the validity and operational feasibility of two methods (Summary of article by Isanaka et al, 2018)
Used since 2012, the Semi-Quantitative Evaluation of Access and Coverage (SQUEAC) employs both qualitative and quantitative methods to identify key barriers to access and estimate coverage of therapeutic feeding programmes (TFP) and presents a step forward in the coverage assessment of nutrition programmes. While the tool has been increasingly used in programmes, the validity of certain methodological elements has been the subject of debate.
A study was conducted comparing a SQUEAC conjugate Bayesian analysis to a two-stage cluster survey estimating the coverage of a TFP in Niger in 2016. The two-stage cluster survey had a spatially stratified first stage selecting communities and active and adaptive case-finding in the second stage and used a very similar comparison method to that of SQUEAC stage III likelihood surveys (the only difference being that a larger sample size was used). Results showed point estimates of coverage made from the likelihood data alone were similar to those made from the larger two-stage cluster survey. Observed differences between SQUEAC results and the results of the two-stage cluster survey, therefore, revealed that the conjugate Bayesian analysis was sensitive to the prior distribution of belief about programme coverage. With the exception of priors produced by an external support team, all priors resulted in a conflict with the likelihood result, excluding interpretation of the final coverage estimate based on the conjugate analysis. Allowing for increased uncertainty around the prior estimate did not materially affect conclusions.
The authors conclude that the SQUEAC conjugate Bayesian analysis proposed for coverage estimation can be a technically demanding method that depends on the accuracy of the prior. Methods to develop a final prior estimate have been suggested, but there is little evidence regarding the validity of their application in capacity-limited settings. Subjective and overly certain prior estimates produced from these methods may render the final coverage estimate invalid or imprecise. The appropriate technical capacity is necessary during prior estimation to ensure informative results. More research to review and validate methods to produce accurate prior estimates may be needed.
Read a poscript by Sheila Isanaka, Rebecca F. Grais, and Ben G.S. Allen on this article here.
References
Isanaka S, Hedt-Gauthier BL, Grais RF, Allen BG. Estimating program coverage in the treatment of severe acute malnutrition: a comparative analysis of the validity and operational feasibility of two methods, Population Health Metrics, 2018,16:100,1-9 Full text available from: https://pophealthmetrics.biomedcentral.com/articles/10.1186/s12963-018-0167-3
Myatt M, Guevarra E, Fieschi L, Norris A, Guerrero S, Schofield L, Jones D, Emru E, Sadler K (2012) Semi-Quantitative Evaluation of Access and Coverage (SQUEAC) / Simplified Lot Quality Assurance Evaluation of Access and Coverage (SLEAC) Technical Reference, Food and Nutritional technical Assistance III Project (FANTA-III), FHI 360 / FANTA, Washington, DC, October 2012 www.fantaproject.org/monitoring-and-evaluation/squeac-sleac
Myatt M (2013) BayesSQUEAC v3.00: A graphical calculator for Bayesian beta-binomial conjugate analysis of coverage proportions in CTC and CMAM programs using a bootstrap aggregating (bagging) estimator implementing sample size calculation and formal testing for priorlikelihood conflicts, Brixton Health / Valid International, Oxford, UK, 2013.