
Impact evaluation of WASH in nutrition intervention on morbidity and acute malnutrition in Niger
By SaïdouTamboura, Dr Moussa IssaLende and Lucia Pantella
Tamboura Saïdou has worked in nutrition and health for 14 years. He has worked in nutrition emergency responses in several countries and has been the Nutrition Coordinator and Field Manager for COOPI (Cooperazione Internazionale) Niger since 2016.
Dr Moussa IssaLende is a consultant for COOPI. He has over seven years’ experience in planning, implementation, management, monitoring and evaluation of policies and programmes related to cash, food security, health and nutrition in situations of emergency and development in Niger and other countries.
Lucia Pantella is the Nutrition Adviser for COOPI working mainly in West Africa and Sahel Region. She is a registered nurse and holds a master’s degree in humanitarian programme management. She previously worked with Save the Children and Intersos in several humanitarian crises.
The authors acknowledge European Civil Protection and Humanitarian Operations (ECHO) for financing the project described here. COOPI has been receiving funding from Directorate General (DG) ECHO for the implementation of nutrition projects in Niger since 2012. The authors would also like to acknowledge UNICEF for supporting WaSH in Nutrition in COOPI Niger.
Location: Niger
What we know: There is increasing drive to integrate nutrition and water, sanitation and hygiene (WASH) interventions, including those targeted at malnourished children.
What this article adds: An evaluation was carried out of a year-long integrated water, sanitation and hygiene (WASH) in nutrition (WiN) programme in Tillabery, Niger in 2017 by Cooperazione Internazionale (COOPI). WASH facilities were improved in 11 outpatient therapeutic centres (OTPs) and one stabilisation centre providing acute malnutrition management services; 1470 WiN kits were provided to households of all children with severe acute malnutrition (SAM) to support personal hygiene, water treatment and water storage until 30 days after discharge; and WASH education sessions were provided in the same villages. Results showed no difference in OTP performance indicators between intervention and control areas with the exception of the non-response rate in intervention sites (4 to 2%). Improvements in hygiene practices and significantly lower diarrhea co-morbidity were found in intervention households receiving WiN kits and community awareness sessions compared to controls. Co-morbidity (diarrhoea) was prevalent in all sites. In this context, scale up of WiN activities, strengthened diarrhoea treatment and village level water treatment, are warranted.
Background
Malnutrition is a chronic public health problem throughout Niger. Results of a 2016 SMART survey show a global acute malnutrition (GAM) rate of 9.3% and a severe acute malnutrition (SAM) rate of 1.9% for the Tillabery region. For a population of 322,381 people, Tillabery has 32 health centres with outpatient theapeutic programes (OTPs) with one primary healthcare facility per 10,074 people (compared to Sphere standards recommendations of 1/10,000), one District Hospital for the whole population (Sphere standards recommend 1/250,000), a doctor ratio of 1/40,297 (compared to World Health Organization (WHO) recommendations of 1/10,000), a nurse ratio of 1/8,059 (WHO recommends 1/5,000) and a midwife ratio of 1/22,605 (WHO recommends 1/5,000).
Cooperazione Internazionale (COOPI) has been working in Niger since 2012 to respond to the humanitarian needs of people affected by crisis, conflict and displacement. COOPI has operated a programme to improve the management of SAM in Tillabery since 2012 in partnership with European Civil Protection and Humanitarian Aid Operations (ECHO), World Food Programme (WFP) and the Food and Agriculture Organization (FAO). Technical support has been provided to improve OTP and stabilisation centre (SC) performance indicators and quality of care in OTPs. Since 2015 the programme has focused particularly on community mobilisation to raise awareness of malnutrition within the community and strengthen prevention and early detection, with the support of families, in particular mothers. GAM rates have not significantly reduced in Tillabery since this time, however, achievements worthy of note include good and stable OTP and SC performance indicators; improved quality of care in OTPs; increased community participation; involvement of local communities in growth monitoring activities and heightened awareness of community leaders on the extent of the problem of malnutrition and their increased commitment to act.
WASH in Nutrition (WiN) intervention
Overview
Since 2017 COOPI has integrated WASH into its nutrition programme through the WASH in Nut (WiN) strategy.1 In 2016 COOPI conducted an assessment in 32 health centres, which showed that none of the surveyed facilities respected the 12 standards set by the WiN strategy. Hand washing devices (water point, soap, disinfectant) were absent in the majority of the surveyed facilities. As a result, COOPI decided to strengthen the WASH component both at facility and community level. At facility level, WASH facilities were improved. At community level, a WiN kit was provided to all SAM children admitted to the community based management of acute malnutrition (CMAM) programme in 11 health centres in areas facing recurrent drinking water supply problems during the rainy season, as well as to all children treated as inpatients at the District SC.
Targeted health areas (Assani, BosseyBangou, Guru, Kandaji, Kofonou, Kurani, Mari, Sawani, Sona, Theim and Wissili) were selected in collaboration with the Regional Directorate of Hydraulic and Sanitation of Tillabery. The households of targeted children received the WiNkit to support personal hygiene, water treatment and water storage for the entire family for the whole duration of SAM treatment plus 30 days after discharge. Depending on the type of water consumed, two kits were distributed: SAM children living in communities with access to river water (cloudy surface water) received a kit consisting of ‘pur’ (a powdered mixture to treat contaminated water), a cup, a permeable fabric and soap; SAM children living in communities with access to water from boreholes or wells received ‘aquatab’, jerry cans and soap (Figure 1). The quantity of pur, aquatab and soap distributed was calculated according to number of household members.
Figure 1. Composition of the WiN kits
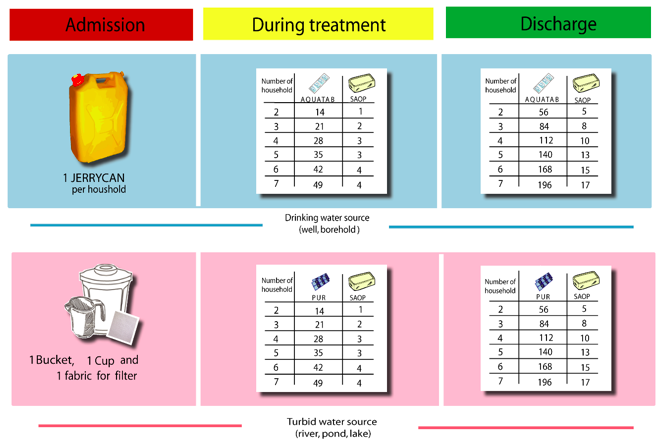
Full kits were distributed to the caregiver on admission and at each weekly follow-up post-discharge the family received soap and either pur or aquatab. On the final follow-up the family received a one-month supply of soap and either pur or aquatab. Consumables (soap, pur and aquatab) were provided by UNICEF and equipment (bucket, cup and jerry can) were provided by COOPI. In 2018, following a post-distribution survey (results below), COOPI also added a kettle to the kits.
Each village from which a child was admitted to the programme received awareness raising sessions on hygiene and sanitation practices, starting the week following the child’s admission. Sessions were run by community mobilisers and aimed to raise awareness among household heads and the wider community on the importance of hygiene and water quality for the treatment of SAM, the prevention of certain diseases (including diarrhoea) and to discourage the sale of kit items on local markets. Mobile teams also used village visits to determine the chlorine load and drinking water pH for the household of each beneficiary. In total 70 households were sensitised once a week for at least four weeks in 288 villages. MUAC-trained mothers (6,000 in total) were also used to reinforce positive WASH messages within their villages.
Post distribution monitoring
A post-distribution monitoring survey (PDM) was conducted from 8 to 15 February 2018 on a representative sample of beneficiary households randomly selected to evaluate the impact of sensitisation activities on hygiene practices and use of WiN kits. Indicators assessed included carrying out hand washing in the critical moments of the day, the correct treatment and storage of water. The PDM also included a beneficiary satisfaction survey concerning the content of the kit and hygiene education sessions and sought to identify mechanisms for sustainability of the project using local means.
The results of the PDM showed that, during the first year of implementation, 1470 WiN kits were distributed through the 11 OTPs and one SC against the1833 expected (80.2%). By the end of the first year all health centres were meeting WASH standards due to the installation of 28 handwashing points and routine treatment of water used for the ‘appetite’ test. The satisfaction survey showed that all beneficiaries surveyed (n=1098) were satisfied with their kits and that households had used them. Household handwashing practices also improved due to the availability of soap
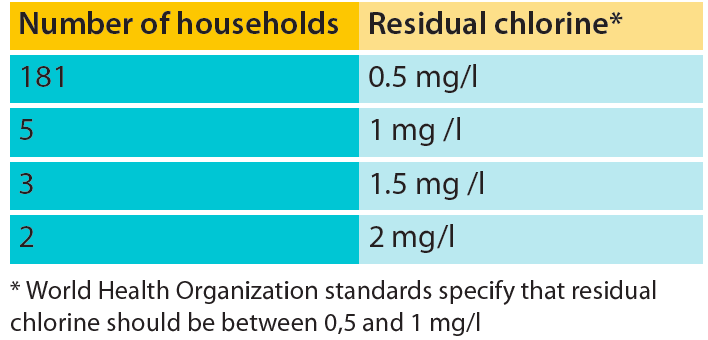
The quality of drinking water within households was satisfactory, with chlorine levels in the recommended range in 95% of beneficiary households (Table 1) and pH levels ranging from 6.8 to 7.2 (within the WHO standard range of 6.5 and 9) for 92% of households.
Table 1: Residual chlorine present in water in beneficiary households
Evaluation of the WiN intervention
Impact of the WiN programme on SAM treatment was evaluated after one year in 2017 in terms of the performance criteria of targeted OTPs (average length of stay, relapse rate and defaulting rate); morbidity and prevalence of diarrheal diseases in SAM children; and hygiene and sanitation knowledge, practices and attitudes in health centres, beneficiary households and non-beneficiary households. The purpose of the evaluation was to contribute knowledge to improve implementation of WiN activities in the health centres and at community level and to learn lessons and make recommendations for future COOPI nutrition-sensitive interventions.
The sample size was calculated using the software ENA 2011 for SMART using SAM prevalence in Tillabery region of 1.9%, precision of 5%, a cluster effect of 1.5, the proportion of children under five years old as 18% (by Regional Directorate of Public Health (RDPH of Niger), average household size of five and non-respondent rate of 3%. The total size of the sample to be surveyed was 88 mothers of SAM children out of 180 households drawn by ENA software. As this is a case control study in 22 health areas, the number of children and households to be surveyed was multiplied by two to 176 children in360 households (half in 11 intervention areas and half in 11 control areas). The selection of health centres and health workers to be surveyed was based on exhaustive sampling. The selection of health centres from which mothers of SAM children were selected in the intervention and control areas was determined by a random draw. Data processing and analysis was carried out using SPSS 21, Excel and Word software.
Results
SAM management performance indicators
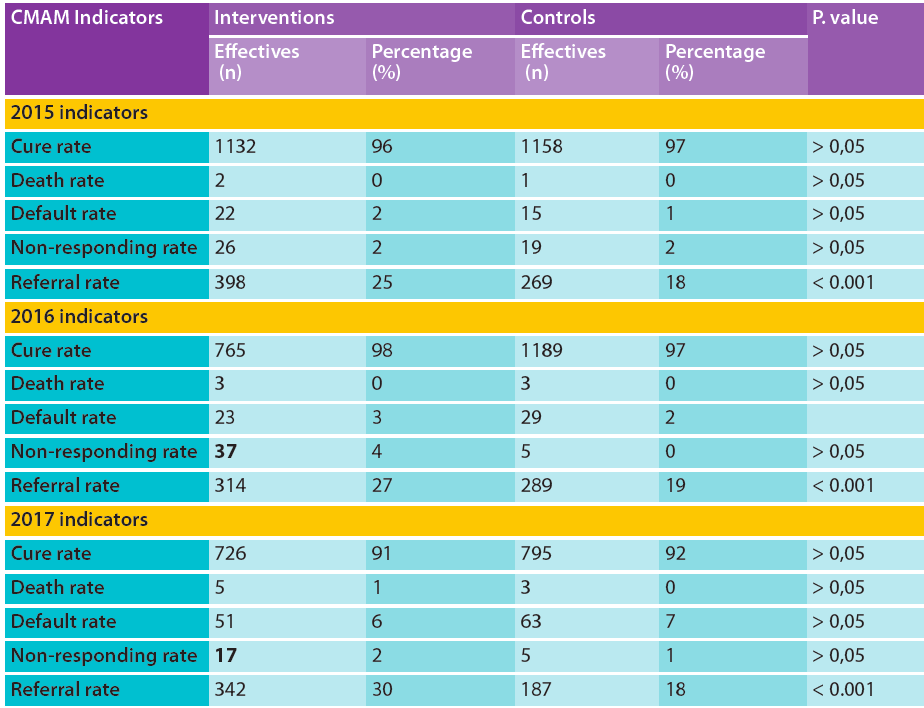
The results of the impact evaluation showed that all performance indicators exceeded the minimum standards set by the national protocol both in intervention and control areas. This good performance could be explained by the technical support provided by COOPI since 2012 to build the capacity of health workers in OTPs across control and intervention areas. Results show no difference in performance indicators between intervention and control areas with the exception of the non-response rate, which reduced from 4% (n=37) to 2% (n=17) from 2016 to 2017 in intervention health centres (Table 1).
In addition, there was a significant difference in referral rates between intervention and control areas. Since 2015 referral activities have been strengthened in the intervention areas through the scaling up of the MUAC mother strategy, through which volunteer mothers are trained in the detection of SAM children and their referral to the health centers. Since 2015 more than 6,000 mothers in 400 villages (60% of whom are located in the intervention areas) have been trained and equipped with a MUAC bracelet; this has led a positive impact in performance indicators, with increased programme coverage (from 52.3% in 2015 to 59.9% of 2017), especially in the interventions areas.
Table 2: Indicators of malnutrition management in health centres in 2015-2017
Morbidities in SAM children
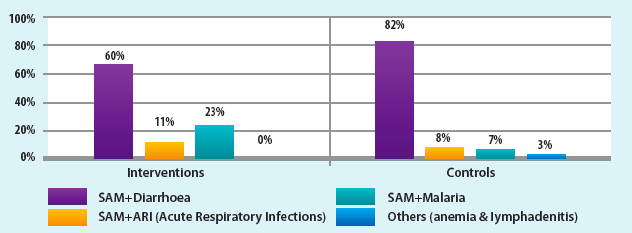
The evaluation of morbidities among SAM children in both intervention and control households showed that 28% suffered only from SAM, while 78% of children suffered from SAM associated with other diseases; 22% of acutely malnourished children haddiarrhoea. Diarrhoea associated with SAM was more prevalent among children in the control health centres (82%) than in intervention health centres (66%) (p<0.02) (Figure 1). Diarrhoea affected girls more than boys in control households (58%) and intervention households (54%).
Figure 2: Diseases associated with SAM in intervention and control households
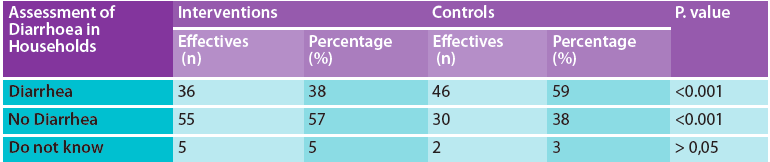
At the household level 59% of children in control households had diarrhoea during the two weeks preceding the survey, compared to38% of children in intervention households, revealing a statistically significant difference (P <0.001) (Table 3). This result could be explained by the reaching of minimum WASH standards in intervention households due to the presence of WiN kits and by the effectiveness of community education and participation of mothers in project implementation. The main treatment for diarrhoea in both intervention and control households is based on the combination of oral rehydration solution (ORS) and zinc, disseminated by health centres.
Table 3: Assessment of diarrhoea in intervention and control households
WASH practices
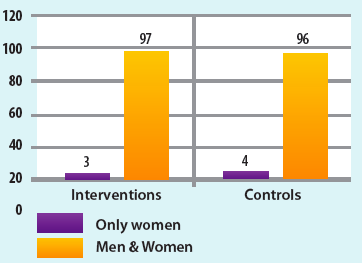
The survey revealed that 80% of households in intervention areas had treated drinking water with aquatab or pure, compared to 21% of households in control areas (Table 3). Ninety-seven percent of women and men in households in the intervention area compared to 96% of women and men in control households used latrines (no significant difference).
Table 4: Drinking water
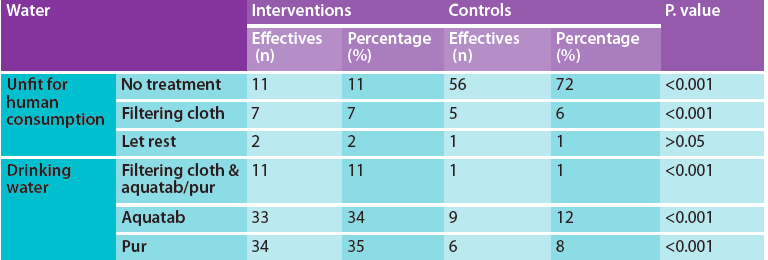
Figure 3: Use of latrines
There are 12 UNICEF WASH standards applicable to health centres, each of which was evaluated. All intervention health centres achieved the minimum standards set by the UNICEF WiN strategy; 100% of patients and staff had access to a clean water point and handwashing device and each health centre had a waste management system and an improved latrine.
Figure 4: Source of drinking water
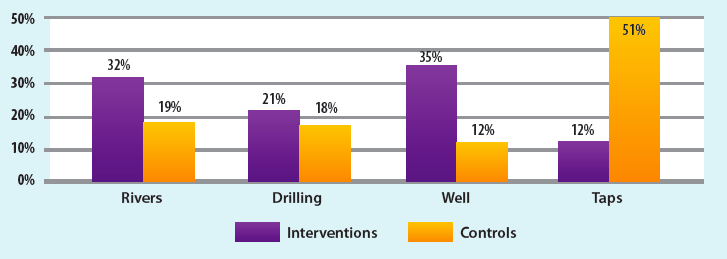
Regarding the main sources of drinking water, intervention households mainly used well (35%), rivers (32%) and drilling (21%), and only 12% used water from taps. In the control households, the main source of water was taps (51%), followed by rivers (19%), drilling (18%) and wells (12%). This result confirms that the interventions areas were selected among those communities which have faced more recurrent drinking water supply problems, especially during the rainy season.
With respect to handwashing, 36% of intervention households used a handwashing device with soap or disinfectant compared to 12% of control households. Results showed that94% of intervention households had knowledge about the key moments of hand washing compared to 82% of control households. The majority of intervention households washed hands at the ideal time (before and after meals) (60%), compared to 44% in control households. Reasons given for washing hands in 31% of intervention households were the prevention of faecal peril, diarrhea and parasites and to clean hands. The reasons given for hand washing in 32% of control households concerned the prevention of parasites.
Table 5: Household handwashing
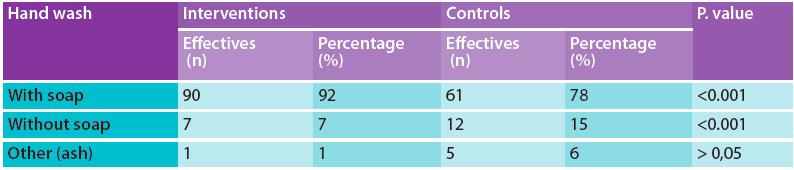
Ninety-two percent of mothers in intervention households versus 78% mothers in control used soap for hand washing. In control areas in cases where soap was not used, ash was commonly used to wash hands instead. The quality of hand washing differed significantly between intervention and control households (p <0.05). This could be the result of availability of soap provided throughout the project as well as awareness sessions on good hygiene practices at health centres and in the community.
Concerning household sanitation, latrines were used more in control households (71%) compared to intervention households (37%). Sixty-one per cent of mothers in intervention households compared to 55% of mothers in control used the latrines twice daily (no significant difference). Eighty-six per cent of intervention households kept the latrine clean compared to 72% of control households. The good availability of latrines in control areas was an initial advantage for many households; however results show that this was not synonymous with good sanitation practices in the same households. This reflects the need to accompany access to latrines with hygiene and sanitation education to improve their use.
Study limitations
CMAM performance indicators (such as default rates and non-response rates) may have been influenced not only by the WiN activities by other external factors. For example, the referral rate in the intervention zones may have been affected by other community activities, such as the mothers MUAC approach which has been particularly promoted in these zones.
The PDM was conducted by COOPI project staff, which may have induced a bias in beneficiary responses. Conversely the analysis of the data was conducted by an external consultant.
The results of this study reflect the impact of WiN activities after one year of implementation. The WiN strategy should be systematically integrated into nutrition programmes in order to have long lasting results in intervention communities.
Conclusion and recommendations
The evaluation of the WiN project indicates no difference in performance indicators between intervention health centres with improved WASH facilities and control health centres, but significant, positive impact on the non-response rate of acutely malnourished children in intervention compared to controls. Results at household level show significant improvements in hygiene practices and significantly lower diarrhoea co-morbidity in households receiving WiN kits and community education compared to controls. This suggests that in order to reduce morbidity and mortality rates related to diarrhoea, scale up of WiN activities is warranted both at community and household levels. Distribution of the WiN kits should be accompanied by behaviour change communication activities, particularly around prevention of disease through improved hygiene, treatment of water before consumption and use of household latrines.
Future WiN strategies should include the strengthening of health worker skills to treat diarrhoea and to promote and disseminate WiN awareness messages, for example during vaccination campaigns, to help its prevention. Further collaboration between government ministries relating to nutrition and WASH at all levels is also needed in order to carry out joint interventions, such as the creation of water treatment sites in villages with high prevalence of SAM. All activities should be supported by effective monitoring mechanisms in order to understand the effectiveness of interventions and guide future programming.
Endnote
1Regional, Central and West Africa Group WiN Strategy ://www.susana.org/_resources/documents/default/3-2297-7-1438183632.pdf