
Using MUAC to predict and avoid negative outcomes in CMAM programmes: Work inspired by en-net
By Odei Obeng Amoako Adobea Gloria, Franck Alé, Paul Binns, Kevin Phelan, Jose Luis Álvarez Moran, Casie Tesfai and Mark Myatt.
Odei Obeng Amoako Adobea Gloria is a doctoral fellow of the Clinical Epidemiology Unit at the School of Medicine, College of Health Sciences, Makerere University, Kampala, Uganda.
Franck Alé is an epidemiologist at the Department of Preventative Medicine and Public Health at University Rey Juan Carlos, Madrid, Spain.
Paul Binns is a community-based management of acute malnutrition specialist at Brixton Health.
Kevin Phelan is a nutrition advisor at ALIMA.
Jose Luis Álvarez Moran is Technical Advisor for Nutrition at the International Rescue Committee (IRC).
Casie Tesfai is Senior Technical Advisor for Nutrition at IRC.
Mark Myatt is a consultant epidemiologist at Brixton Health.
Location: Global
What we know: Targeting more intensive treatment to acutely malnourished children at greater risk is one strategy to improve the effectiveness and cost-effectiveness of treatment programmes.
What this article adds: Prompted by questions on en-net, OTP data from eight CMAM programmes was pooled and analysed to determine the performance of MUAC at admission for predicting negative treatment outcomes (n=5,842). The sensitivity and specificity estimated at each MUAC threshold were plotted as a receiver operating characteristic (ROC) curve and the area under the ROC curve (AUC) estimated using the trapezoidal rule (diagnostic test performance). The optimal MUAC threshold for predicting negative treatment outcomes was identified using the maximum observed value of Youden’s Index (diagnostic effectiveness). The maximum observed value of Youden’s Index was 34.23% using MUAC < 109 mm with a sensitivity of 50.00% and a specificity of 84.23%. In practice, a MUAC threshold used alongside other predictors of risk (i.e. clinical signs and history, appetite test, and other triage criteria present in a programme’s ‘action protocol’) could be useful when deciding care pathways at admission or during treatment.
Background
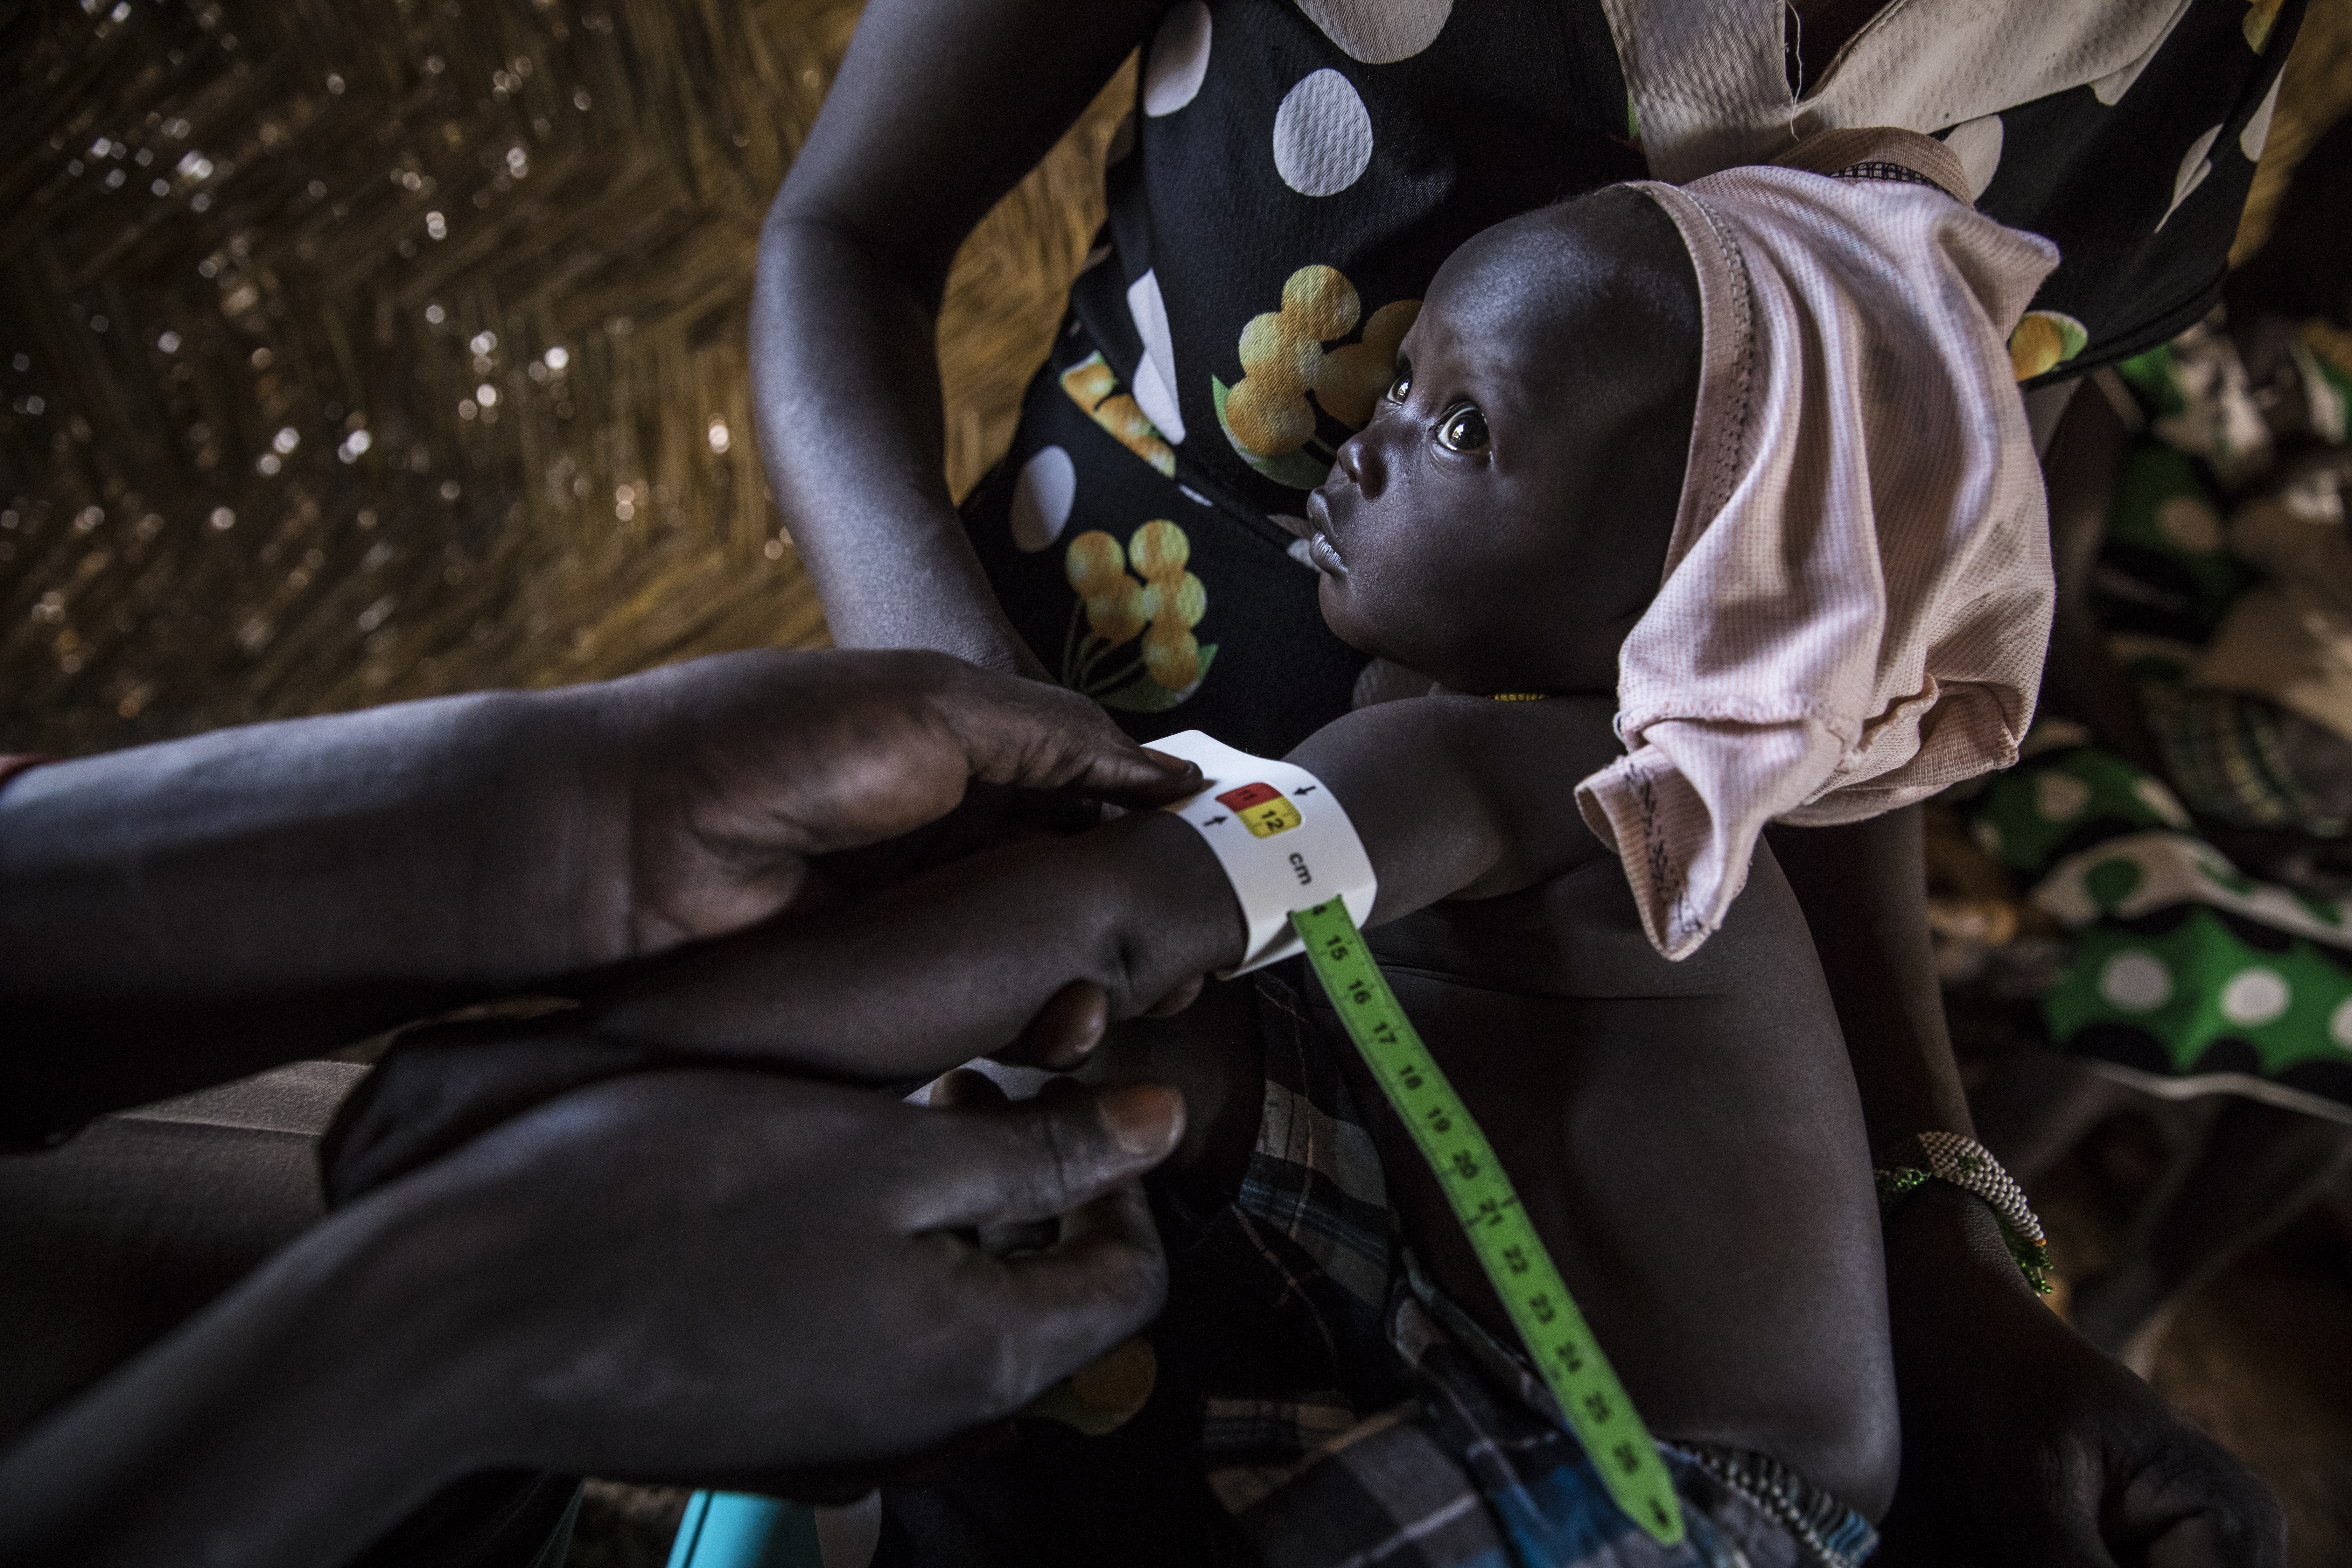
The work reported here is a response to a discussion on en-net discussion forums about monitoring and interpreting mid-upper arm circumference (MUAC) at admission in community-based management of acute malnutrition (CMAM) programmes.1
There was some discussion regarding how MUAC at admission is interpreted in SQUEAC coverage assessments using a distributions approach. CMAM and SQUEAC experts on the forum suggested a number of thresholds that might be used to predict good coverage (e.g., > 75% of admissions with MUAC ≥ 110 mm), define late admission (e.g., admission MUAC < 105 mm), or identify cases of severe acute malnutrition (SAM) with very high risk of mortality for automatic referral to inpatient care or triage (e.g., admission MUAC < 100 mm).
The discussion turned to establishing a threshold for an additional band on MUAC tapes that could be used to select children most likely to require more intensive monitoring or more intensive treatment (e.g., children being directed for more intensive clinical examination at admission and follow-up at subsequent visits, weekly rather than fortnightly outpatient therapeutic feeding programme (OTP) attendance, or inpatient care). This article attempts to addresses this particular issue.
Methods
We collected OTP data from eight CMAM programmes (see Table 1). Data from children with MUAC ≥ 115 mm at admission were discarded. Children who died during treatment or were discharged as not responding to treatment or who were transferred to inpatient care during the treatment episode were classified as having a negative outcome. Defaulters were excluded from the analysis presented here because their outcomes were uncertain.
Table 1: Characteristics of the eight cohorts of patients

* All admission criteria included bilateral pitting oedema and age between 6 and 59 months.
MUAC is measured in mm. WHZ is measured in z-scores.
** All discharge criteria included loss of oedema/absence of oedema.
*** The number of cases with MUAC < 115 mm at admission (excluding defaulters).
Data from the eight programmes were pooled. The performance of MUAC at admission for predicting negative treatment outcomes (i.e., death, non-response or transfer to inpatient care) was examined by calculating the sensitivity and specificity of MUAC below systematically varied thresholds for predicting negative treatment outcomes. The thresholds used ranged between the minimum and maximum observed MUAC at admission in steps of 1 mm. The sensitivity and specificity estimated at each threshold were plotted as a receiver operating characteristic (ROC) curve and the area under the ROC curve (AUC) estimated using the trapezoidal rule. An ROC curve charts the performance of a diagnostic or predictive test. The ROC curve and its associated AUC estimate summarise the performance of a diagnostic or predictive test (see Figure 1). The AUC corresponds to the probability that, given two randomly chosen people, one with a negative outcome and one without a negative outcome, the test will rank the person with a negative outcome with a higher suspicion of having a negative outcome than the one without a negative outcome. For example, an AUC of 0.70 means that, of two randomly chosen people, there is a 70% chance that the person with a negative outcome will be ranked with higher suspicion of having a negative outcome than the person without a negative outcome.
Figure 1: Some features of a ROC curve

The optimal MUAC threshold for predicting negative treatment outcomes was identified using the maximum observed value of Youden’s Index. Youden’s Index is a function of both sensitivity and specificity:

Youden’s Index is a commonly used measure of diagnostic effectiveness. The maximum value of Youden’s Index occurs at the threshold that optimises a test’s ability to differentiate between cases (e.g., negative outcomes) and non-cases (e.g., positive outcomes). This occurs at the point on the ROC curve with the maximum vertical distance from the diagonal (chance) line to a point on the ROC curve (see Figure 1). Youden’s Index may range between zero (the test is useless) and 100% (the test is perfect).
All data analysis was performed using purpose-written R language (version 3.5.3) scripts managed using the R-Analytic-Flow scientific workflow system (cersion 3.1.8).
Results
The ROC curve for predicting negative outcomes using MUAC at admission based on all 5,842 admissions with MUAC < 115 mm who did not default is shown in Figure 2. The area under the curve is AUC = 0.72. This is considerably better than chance. The maximum observed value of Youden's Index was = 34.23% at MUAC < 109 mm with a sensitivity of 50.00% and a specificity of 84.23%. The MUAC thresholds for the maximum value of Youden’s Index for the separate programmes were similar to each other.
Figure 2: ROC curve for predicting negative outcomes using MUAC at admission, using data from all 5,842 admissions who did not default from eight programmes

The point of the maximum observed value of Youden’s Index is marked (see text). The maximum observed value of Youden’s Index was 34.23% using MUAC < 109 mm with a sensitivity of 50.00% and a specificity of 84.23%. The area under the ROC curve (AUC) was 0.72. The dashed line is the line of chance.
Discussion
In this application, sensitivity is the proportion of negative outcomes that are correctly predicted as negative outcomes and specificity is the proportion of positive outcomes that are correctly predicted as positive outcomes. Use of a very high MUAC threshold would predict all negative outcomes (i.e., have 100% sensitivity) but would also make very many false predictions (i.e., have a low specificity). Good tests have both high sensitivity and high specificity. This is not always possible to achieve and a trade-off between sensitivity and specificity has to be made. For relatively uncommon outcomes (e.g., treatment failure in OTP) the trade-off will usually be for moderate sensitivity and high specificity. This avoids workload being inappropriately dominated by large numbers of false positive predictions. It is usually a safe compromise if other tests are also used (see Table 2) and routine monitoring of response to treatment is practised. In our analysis we found that MUAC alone predicted negative treatment outcomes with moderate sensitivity and good specificity.
Youden’s Index ≥ 50% is usually required for a stand-alone diagnostic test. This was not achieved in our analysis. This is acceptable, however, if we expect the test to be used with other tests (see Table 2).
Table 2: Example OTP admission checklist/triage rules/action protocol*

* This table is presented for illustration purposes only. Always use local examination rules/triage rules/action protocols, which are usually presented in national CMAM protocols and guidelines.
MUAC used alongside other predictors that are currently used in therapeutic feeding programmes (i.e. clinical signs and history, the ready-to-use therapeutic food (RUTF) appetite test, and other triage criteria present in a programme’s ‘action protocol’) could be useful when deciding care pathways at admission (see Table 2). For example, children with MUAC < 110 mm at admission and either ill at admission or with a history of illness in the previous seven days could receive a thorough clinical examination and more intensive counselling at admission (see Table 2). It may also be safe for children with MUAC ≥ 110 mm without current illness and without a history of recent illness to attend OTP every two weeks, rather than every week. Programmes using fortnightly follow-up might use weekly follow-up for children with MUAC < 110 mm with current illness or a history of recent illness for the first few weeks of treatment. Programmes using community health workers to deliver CMAM services could refer children with MUAC < 110 mm or illness or a history of recent illness to health centres for further assessment. Priority could also be given to more rigorous follow-up of absentees and defaulters with MUAC < 110 mm or illness at their most recent visit. Adaptations such as these should be tested by further operational research before being adopted as a routine practice in OTP programmes in order to avoid unintended consequences (such as unmanageable increases in staff workload or increasing costs to beneficiary households of accessing care).
Adaptations such as the ones outlined above may help to reduce negative outcomes, but their effect will be limited. The probability of a negative outcome decreases as MUAC at admission increases. Negative outcomes may, therefore, be reduced by early case-finding and prompt treatment-seeking behaviours using strategies such as regular and frequent at-home MUAC screening by mothers or other family members. Better compliance with the OTP treatment protocol by the beneficiary also decreases the probability of a negative outcome. Negative outcomes may be reduced by (e.g.) reducing intra-household sharing of RUTF, reducing sale of RUTF and increasing attendance rates. Programmes can also have compliance deficits such as RUTF stock-outs and partial delivery of services. These also increase the probability of negative outcomes. Maintaining protocol compliance and continuity of care by programmes may also reduce negative outcomes.
Research and pilot programmes have demonstrated the feasibility of delivering different intensities of treatment for children with MAM and SAM within a single therapeutic feeding programme. The analysis reported here used data from one such programme, but data on admissions with MUAC ≥ 115 mm were discarded. We did this in order to provide an analysis that addresses the current most common therapeutic feeding programme model (i.e., OTP admitting using MUAC < 115 mm). The finding of the analysis presented here can, however, be applied without modification to integrated MAM/SAM treatment programmes. These types of programme already have ‘treatment transition criteria’ in which (e.g.) a MAM case becoming a SAM case triggers a switch to more intensive treatment and a SAM case becoming a MAM case triggers a switch to less intensive treatment.
Limitations
There are a number of limitations to this analysis. Nothing is known about what happened to defaulters. Some may have been cured but defaulted prior to a ‘proof-of-cure’ visit. Others may have stopped attending because of a lack of response to treatment. Others may have died and their resulting non-attendance recorded as defaulting. This means that fewer deaths and non-responders may have been recorded than actually occurred. Transfers to inpatient care may also under-represent negative outcomes, as some patients referred to inpatient care may have refused the referral and continued treatment in OTP. Discharge criteria varied. For programmes using a discharge criteria of MUAC ≥ 125 mm, there will likely be a difference in lengths of stay (treatment durations) and an increased potential for absenteeism, default or non-cure compared to programmes using (e.g.) a discharge criteria of MUAC ≥ 115 mm. Our exclusion of defaulters will have reduced effects caused by this issue. The finding that the MUAC thresholds for the maximum value of Youden’s Index for the separate programmes were similar to each other despite the use of different discharge criteria suggests that this was not a major issue.
Conclusion
MUAC at admission when used with other predictors could improve the effectiveness and cost-effectiveness of OTP programmes by helping to reduce the number of negative treatment outcomes. If MUAC at admission can be used to direct patients to less intensive treatment options, focusing attention and resources on those at highest risk, then programme costs could be lowered and cost-effectiveness further improved. Improved outcomes and reduction in crowding at programme delivery sites may also lead to improved programme coverage.
A post on an en-net discussion forum was the starting point for the work described here. En-net was useful in recruiting collaborating researchers and obtaining data. It may be useful for ENN to systematically monitor en-net and to identify, encourage and sponsor similar pieces of operational research, with results published in Field Exchange.
Endnote
1www.en-net.org/question/3243.aspx