
Calculating wasting caseloads and geographic prioritisation of nutrition services in the context of limited data in Afghanistan
By Beka Teshome Bongassie, Said M Yaqoob Azimi and Maureen L. Gallagher
Beka Teshome is Nutrition Cluster co-lead for Afghanistan with Action Against Hunger (AAH). He holds a Master’s degree in applied nutrition and has 20 years’ experience working in nutrition and health in Ethiopia, Nigeria, Yemen, South Sudan and Pakistan.
Said M Yaqoob Azimi is the Information Management Specialist (Nutrition) for UNICEF in Afghanistan. He is a medical doctor with over 16 years’ experience in the reporting, monitoring and management of information systems in development and humanitarian contexts in health and nutrition programmes.
Maureen L. Gallagher was the Chief of Nutrition for UNICEF Afghanistan from August 2018 to August 2020. She is a public health specialist with over 15 years’ experience in nutrition-related programming in Africa and Asia in both humanitarian and development settings.
The Afghanistan Nutrition Cluster geographic prioritisation and caseload calculation for Humanitarian Needs Overview 2020 was enabled by the active participation and contribution of individual members of the Strategy Advisory Group and Assessment and Information Management Working Group. The authors would like to thank Aye Aye Khaine for her input into this article.
The analysis, interpretation and conclusion reflected in this article are those of the authors. They do not necessarily represent the views of UNICEF or Action Against Hunger.
Location: Afghanistan
What we know: In emergencies, reliable and up-to-date data is critical to inform the response but is often limited.
What this article adds: Nutrition Cluster partners in Afghanistan undertook a process to calculate wasting caseloads and prioritise geographic areas for services to inform the Humanitarian Needs Overview (HNO) and funding decisions. People in need were calculated using combined global acute malnutrition (cGAM), based on SMART surveys. As recent SMART survey data was unavailable in many provinces, data from 2015 was used and, where this was unavailable, extrapolations were made using data from adjacent provinces. In total, 2.9 million children under five years and 650,438 pregnant and lactating mothers were identified being in need of life saving nutrition services. Due to lack of funds, provinces were prioritised on the basis of recent SMART survey data and, where this was unavailable, either Seasonal Food Security Assessment data or mid-upper arm circumference (MUAC) screening data from Health Management Information Surveys. Data on five known aggravating factors (diarrhoea prevalence, household food insecurity, immunisation coverage, conflict and risk of COVID-19) were also considered. As a result, 26 priority provinces were identified (of 34). Based on an analysis of emerging needs, gaps and humanitarian partner presence, 88 districts within 21 provinces were finally targeted using funds available. For situations where SMART survey data is unavailable, a globally validated standard methodology and guideline for geographic prioritisation is required to support the better identification and targeting of locations for nutrition services.
Context
The current humanitarian crisis in Afghanistan is widespread and severe; in 2020 it was estimated that 14 million people were in need of humanitarian protection and assistance (OCHA, 2020a). The crisis is characterised by open internal conflict between the government and opposition groups, major internal displacement, increasing food insecurity, high levels of malnutrition, limited access to basic services and access challenges to crisis affected areas.
Malnutrition in all its forms is persistent and widespread across Afghanistan, especially among children under five years of age and pregnant and lactating women (PLW). Acute and chronic malnutrition are highly prevalent with 41% of children under five years of age stunted and 10% wasted (Government of Afghanistan, 2013).
The Afghanistan Nutrition Cluster has been active since 2008. It has over 50 active partners including government, national non-governmental organisations (NGOs), international NGOs, United Nations (UN) agencies, civil society, donors and observers. The national Nutrition Cluster coordination team is currently comprised of a Nutrition Cluster coordinator, an NGO co-lead and a nutrition information management specialist. The director of the Public Nutrition Directorate (PND) is the co-chair from the government counterpart. The Nutrition Cluster strategic advisory group (SAG) provides strategic direction, guidance and advice to the Nutrition Cluster. There are five nutrition technical working groups (TWGs) in Afghanistan housed under the PND, namely integrated management of acute malnutrition, assessment and information management (AIM), mother, infant and young child nutrition, capacity development and micronutrients. The primary responsibility of the TWGs is to provide technical support to partners to improve the quality and coverage of services, develop standard operating procedures, review programmes, identify gaps and problems, complete survey validation (AIM), knowledge management and disseminate information to partners.
The nutrition response in Afghanistan is guided by the terms of reference of the Nutrition Cluster and guidelines and protocols endorsed by the Afghanistan Government. Services for the treatment and prevention of child wasting are implemented through multiple delivery modalities including fixed health facilities (basic health centres, comprehensive health centres, sub-health centres, district and provincial hospitals) and through the deployment of mobile teams to hard-to-reach areas.
Insufficient and delayed funding for lifesaving nutrition activities are major challenges for nutrition partners in the delivery of timely assistance in Afghanistan. As part of the overall joint humanitarian analysis and planning process, the Nutrition Cluster and its partners undertook a process to calculate caseloads (people in need (PiN))1 and prioritise geographic areas for services to inform the Humanitarian Needs Overview (HNO) to help mobilise and prioritise funds for nutrition programming. Given that few recent Standardised Monitoring and Assessment of Relief and Transitions (SMART) surveys exist in Afghanistan and the demographic and health survey (DHS) does not currently include anthropometric data, alternative methods had to be found using available data. This article describes the process undertaken, results and lesson learned.
Caseload calculation
Sources of data for caseload calculation
Following discussions with the SAG and Nutrition Cluster partners, it was agreed that the PiN would be calculated using the combined prevalence of global acute malnutrition (GAM), referred to as cGAM. This is an aggregate indicator that includes all cases of GAM as defined by weight-for-height z-score (WHZ) <-2, mid-upper-arm circumference (MUAC) <125mm, and/or bilateral pitting oedema.2 This is further aggregated into combined severe acute malnutrition (cSAM) and combined moderate acute malnutrition (cMAM) calculated by subtracting cSAM from cGAM).
SMART surveys are the only available source of data for cGAM and cSAM in Afghanistan. However, lack of funding and lack of access to conflict-affected areas meant that recent SMART surveys (2018-2020) were only available for 17 of Afghanistan’s 34 provinces. The decision was collectively made to use the results of available SMART surveys from 2015 onwards which were available for 31 provinces. For the three remaining provinces with no SMART surveys (Wardak, Sar-e-Pul and Faryab), extrapolations were made using the results of adjacent provinces (based on the assumption that the nutrition situation would be similar given that they share similar geographic, population and livelihood characteristics). The most recent population projections issued by the United Nations Population Division3 from September 2019 were used for estimating the total caseload for 2020. The under-five population was estimated to represent 17.3% of the total population and the number of PLW was estimated to represent 8% of the total population (NSIA, 2019).
Caseload calculation methodology
The calculation formula is described in Box 1. Caseloads for SAM (A) and MAM (B) were calculated by multiplying the prevalence of cSAM and cMAM by the under-five population and multiplying this again by a correction factor of 2.6 to cater for incidence of acute malnutrition. The caseload for undernourished PLW (C) was estimated using the proportion of acutely malnourished PLW (MUAC <23cm) in a province multiplied by the estimated number of PLW in that population.
To estimate the likely impact of the COVID-19 pandemic on SAM and MAM prevalence, drawing from the experience of previous malnutrition crises4, it was estimated that SAM and MAM prevalence would increase by 20% in integrated food security phase classification (IPC) 4 provinces, by 15% in IPC 3 provinces and by 10% in IPC 2 provinces.5 This percentage increase was applied to SAM, MAM and PLW caseloads.
We estimated that all children under five years of age and PLWs among internally displaced persons (IDPs), returnees, refugees, vulnerable populations residing in informal settlements and populations affected by rapid onset emergencies, including COVID-19, were nutritionally at risk (requiring infant and young child feeding in emergencies (IYCF-E) support, micronutrient supplementation or blanket supplementary feeding programme (BSFP) services). The number of PiN (D) among these populations was estimated to be 25.3% (17.3% of children plus 8% of PLW).
Box 1: People in need (PiN) calculation formula
Total nutrition caseload (PiN)
=
Number of SAM children under five years (using cSAM) (A)
+
Number of MAM children under five years (using cMAM) (B)
+
Number of undernourished PLW (MUAC <23cm) (C)
+
Number of children and women at risk of malnutrition among IDPs, refugees, returnees, vulnerable populations residing in informal settlements and populations affected by rapid onset crisis and COVID-19 (D)
Caseload results
Using this methodology, it was estimated that, in 2020, 2.9 million children under five years of age and 650,438 PLW were part of the PiN estimate. Of the 2.9 million acutely malnourished children under five years of age, it was estimated that 783,583 children (27%) would suffer from SAM. A further 435,445 children under five years of age, 232,877 PLW and 414,534 mothers and caretakers were also estimated to be nutritionally ‘at risk’ among IDPs, refugees, returnees, vulnerable populations residing in informal settlements and populations affected by rapid onset crisis, including COVID-19. Adding those up, the Nutrition Cluster identified 4.63 million children and women who would need emergency nutrition assistance in 2020.
The highest proportion of malnourished children was located in Kabul (11% of the total PiN), followed by Nangarhar (8.2% of the total PiN), Helmand (6.3% of the total PiN) and Herat (6.3% of the total PiN). Of the total PiN, the COVID-19 pandemic was predicted to have pushed an extra 106,214 children under five years of age into SAM, some 284,688 children under five years of age into MAM and some 87,298 undernourished PLW to require lifesaving treatment and nutritional support.
Prioritisation of provinces for lifesaving nutrition services
The overall estimated cost to provide lifesaving nutrition services to the 4.63 million children and women in need was USD234 million. Insufficient resources and limited programme capacity meant that provinces needed to be prioritised to receive nutrition services.
Estimation of GAM prevalence
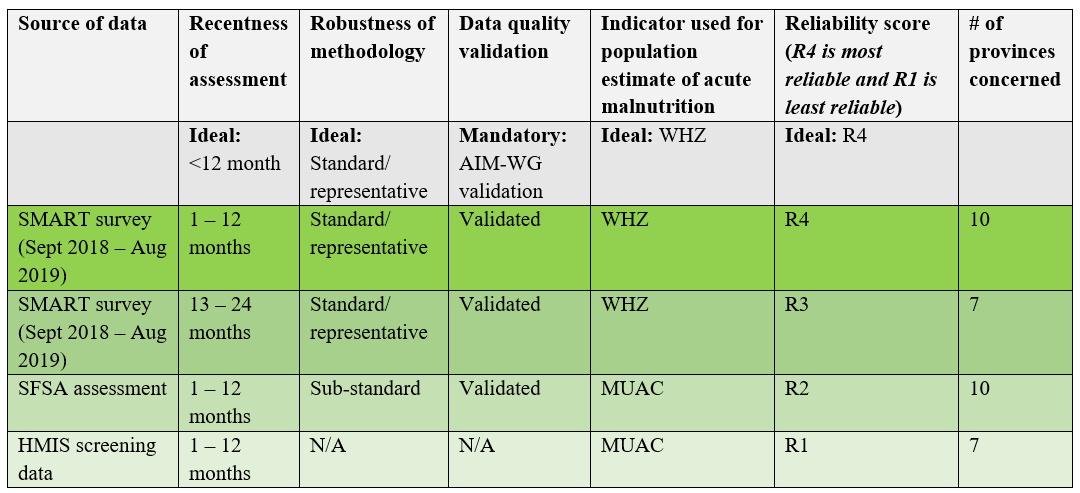
Geographic prioritisation is usually carried out on the basis of the prevalence of GAM among children under five years (based on WHZ) using data from recent SMART surveys, validated by the AIM-TWG. However, as already discussed, recent SMART survey data (2018-2020) was only available for 17 provinces. For 10 of the remaining provinces, MUAC data collected through the Seasonal Food Security Assessment (SFSA) was used, validated by the AIM-WG. MUAC data for children aged 6 to 59 months has been collected via the SFSA since 2019 with support from the Nutrition Cluster to Food Security and Agriculture Cluster partners who provided MUAC training, technical guidance and support during data collection.
In seven provinces where neither SMART survey nor SFSA data was available, the routine 2019 MUAC screening data from health facilities collected within the Health Management Information System (HMIS) was used. Although the results are not directly comparable to the survey data due to differences in methodology, data analysis found them to be fairly consistent with SMART survey data (Figure 1). Table 1 summarises the final GAM data and reliability scores. The identification of high priority provinces was guided by the IPC emergency thresholds for acute malnutrition guidance (IPC, 2019), i.e., ³15% GAM (critical) and/or ³10% GAM (serious).
Figure 1: Comparison of GAM prevalence using 2019 HMIS data vs 2019 SMART surveys in selected provinces where all data was available
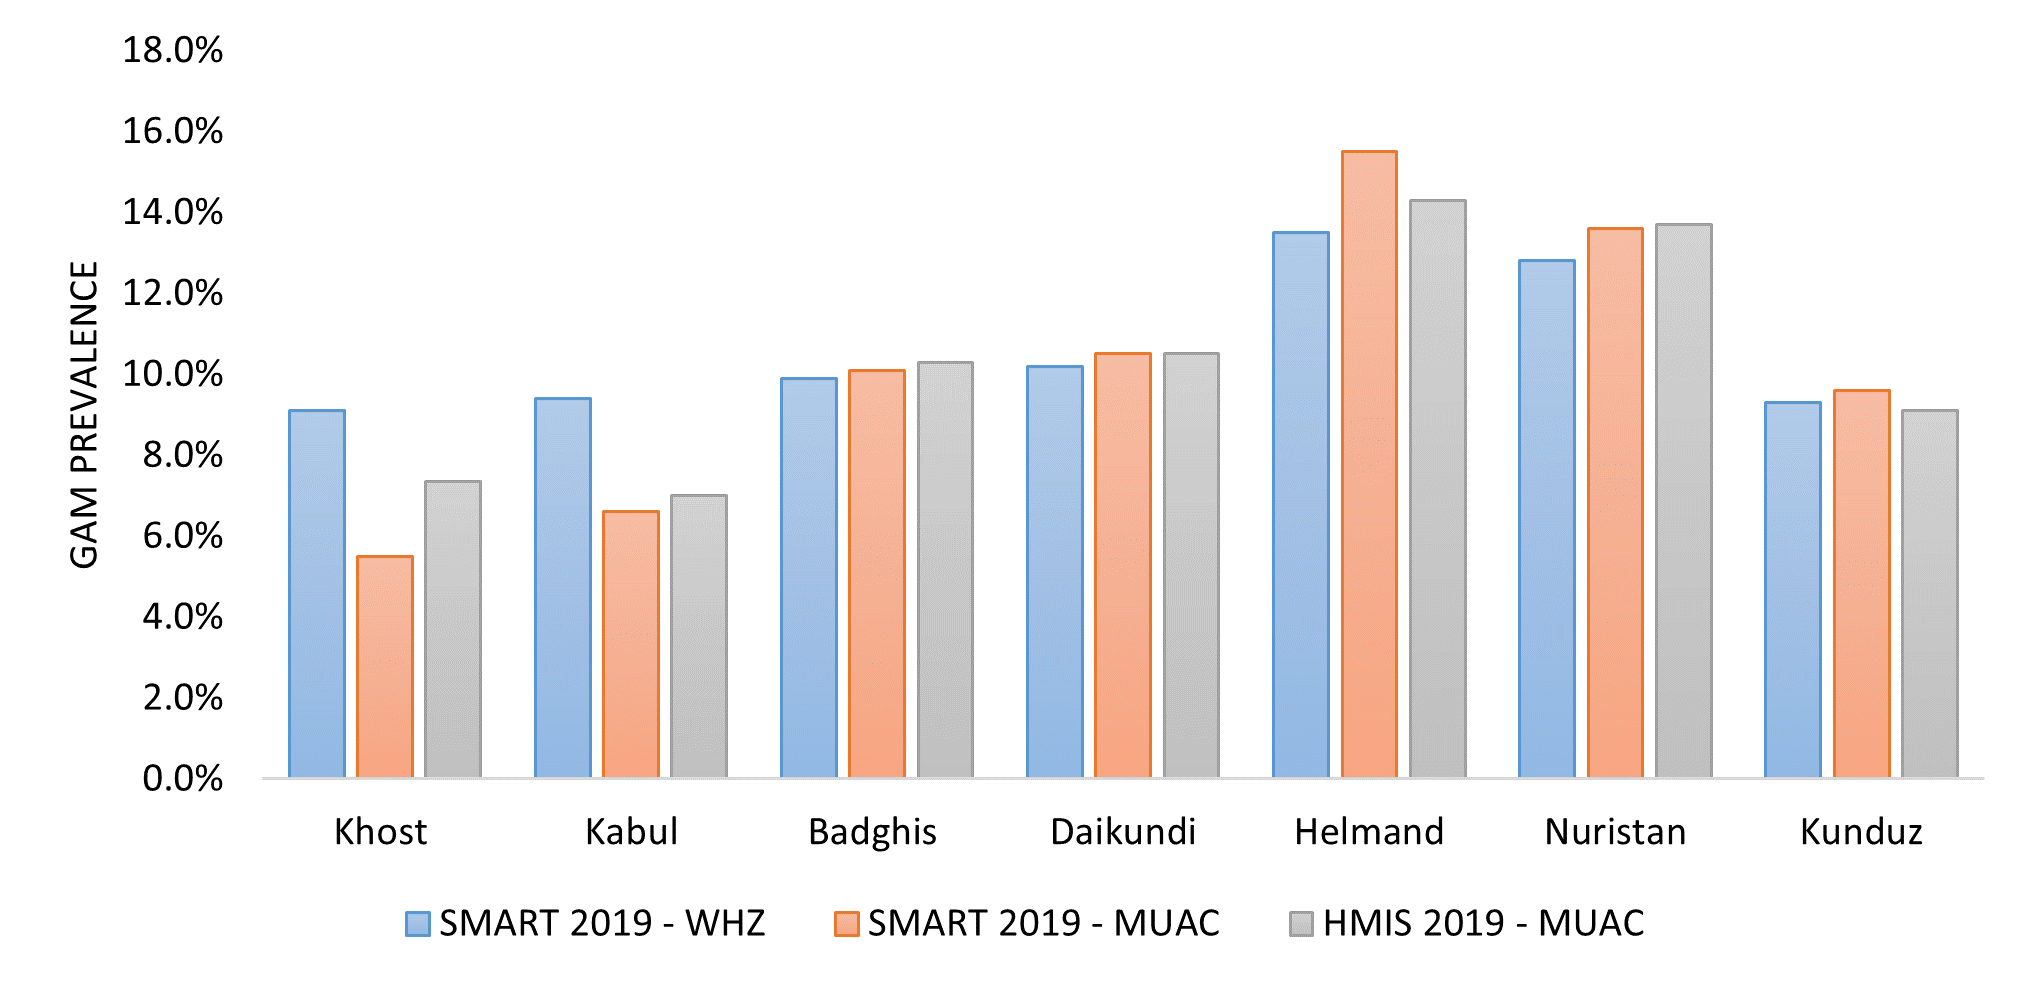
Table 1: Data reliability scores for GAM levels used in Afghanistan
Identification of aggravating factors
To complement the GAM classification, provinces with aggravating factors that are known drivers of acute malnutrition (or hypothesised in the case of COVID-19 risk) were identified. Aggravating factors were selected as follows: prevalence of diarrhoea, household food insecurity, coverage of childhood immunisation, level of conflict (population displacement) and risk of COVID-19 transmission. Multiple available sources of data were used to assess the presence of these factors in each province. These selected thresholds and findings are described in Table 2.
Table 2: Aggravating factors identified in Afghanistan, 2020
|
Aggravating factors |
Data source |
Thresholds |
Findings |
|
2018 Afghanistan Health Survey |
³18.1% (greater than the national prevalence of diarrhoea according to the MoPH, 2018)
|
16 provinces had high prevalence of diarrhoea (above 18.1%) – 13 out of these 16 also had high GAM prevalence (³10%) |
|
International Phase Classification (IPC) |
³36% of people in IPC levels 3 and 4 (above the percentage of the general population in IPC levels 3 or 4 according to FSAC, 2020)
|
15 provinces food insecure (IPC levels 3 and 4 where ³36% households food insecure) – 14 out of these 15 also had high GAM prevalence (³10%) |
|
2018 Afghanistan Health Survey |
Immunisation coverage <50% (less than the national level of immunisation coverage according to the MoHP, 2018)
|
25 provinces had low immunisation coverage (less than 50%) – 21 out of these 25 also had high GAM prevalence (³10%) |
|
Office for the Coordination of Humanitarian Affairs (OCHA) conflict-induced displacement tracker (OCHA, 2020b) |
Number of conflict-induced displaced people ³1,228 (median number of conflict-induced displaced people)
|
12 provinces had high levels of conflict induced displacement – with strong correlation with high GAM rates (Figure 2) |
|
IOM Displacement Tracking Matrix (DTM) Afghanistan (10 March 2020) |
Provinces with ³50% COVID-19 ‘at risk’ districts, through human mobility |
2 provinces had a high number of COVID-19 at risk districts (above 50%). Both of these provinces also had high GAM prevalence (³10%) |
Prioritisation of provinces
The six indicators described above (prevalence of GAM and five drivers) were used to prioritise provinces for nutrition services. High priority provinces were determined as those with critical levels of acute malnutrition (³15% GAM) or serious levels of acute malnutrition (³10% GAM) with two or more aggravating factors (according to the thresholds described in Table 2). A total of 26 provinces were categorised as top priority provinces: nine provinces had a GAM prevalence above 15% and 17 provinces had a GAM prevalence above 10% with two or more aggravating factors (Figure 2).
Figure 2: Afghanistan 26 provinces prioritised for nutrition response in 2020
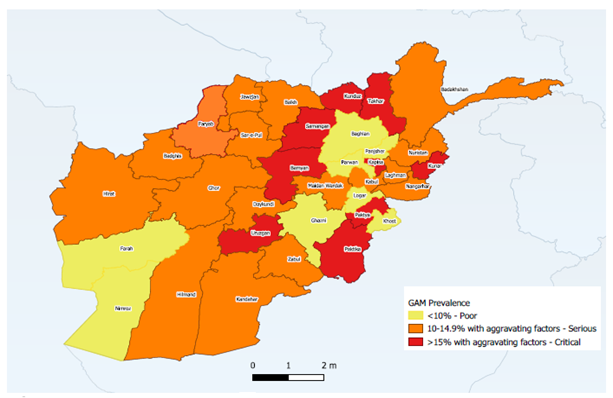
Eighty five percentage of the wasting caseload among children under-five in Afghanistan is present in these 26 priority provinces. This is a total of 2.47 million people. The total cost for reaching PiN in these priority provinces was estimated to be USD139 million.
Further targeting of resources
In the face of overwhelming needs and severe funding constraints, in 2020 the Nutrition Cluster had to further prioritise districts for support for Afghanistan Humanitarian Funding (AHF) through which USD8 million was allocated for nutrition services. A further exercise was therefore undertaken to prioritise districts within the 26 priority provinces for the targeting of these limited resources for lifesaving wasting treatment and prevention services. This exercise was carried out using gap analysis methodology. Information was drawn from the online nutrition database, HMIS, recent nutrition assessment reports, supportive supervision reports and updated information on hard-to-reach districts and functional health facilities. This provided a picture of overall nutrition service coverage and emerging needs and gaps.
Using these results, districts were prioritised if they had emergency levels of GAM (³15%), poor coverage of SAM treatment (<30%), low coverage of functional health facilities or high levels of disruption to health services (due to conflict) with high GAM rates (³10%), or high numbers of recent IDPs with high GAM rates (³10%). Districts were also prioritised where humanitarian partners had operational presence and capacity to implement global and adapted guidelines and standards with COVID-19 preventative measures. As a result of this exercise, 88 districts were targeted in 21 provinces.
Discussion
The estimated wasting caseload of 2.9 million for 2020 is much higher than that estimated in the previous round of calculations in 2019 of 1.58 million. This is partly because all 34 provinces were included in this exercise, compared to 22 in 2019. It is also likely due to the increase in acute malnutrition as a result of the impacts of movement restrictions related to the COVID-19 pandemic resulting in lack of access to services and increased food insecurity in Afghanistan.
Geographic prioritisation and reliable estimates of caseloads for nutrition treatment and prevention services are critical for strategic and operational decision-making and the planning of quality services in the context of competing priorities and limited resources. The SMART survey is the main globally validated methodology for achieving timely and accurate nutrition data at provincial level. However, where SMART survey data is unavailable due to funding shortfalls and operational challenges, the experiences shared here demonstrate that it is possible to bring together a wider set of data for analysis to inform the HNO.
In the context of Afghanistan in 2020, a PiN calculation was made in order to create an understanding of the magnitude of the problem on the ground and to inform the formulation of a response plan based on the real needs of affected communities. In the face of immense needs, the prioritisation of areas for nutrition support was required. This was achieved through a comprehensive analysis of multiple available data sources to identify the prevalence of acute malnutrition and aggravating factors contributing to malnutrition. In the face of very limited resources, a wider gap analysis was also undertaken to prioritise provinces for immediate action.
The process has obvious limitations. Combined prevalence of acute malnutrition was used as a basis for the caseload calculation. However, the availability of SMART survey data covering all provinces within a 12 to 18 month period was limited. Thus, SMART surveys from previous years were used which may have resulted in the under or overestimation of caseloads in those provinces. The use of HMIS nutrition data to prioritise provinces also has limitations as facility-based routine screening may be subjected to an unknown level of sampling bias. A further limitation is that the impact of COVID-19 on the nutrition situation is not yet well understood. Data shows an initial drop in the uptake of nutrition services due to fear of transmission with a subsequent rise in the adaptation of programming based on international guidelines. However, the actual impact on nutrition status is still unknown and therefore caseloads in this exercise may be over or underestimated.
Conclusion and Recommendations
Despite the limited availability of gold standard data, it is possible to use a wider data set of proxy indicators to estimate caseloads and undertake prioritisation to target limited resources to people most in need. This exercise has demonstrated the increasing severity of the crisis in Afghanistan and the need for a higher coverage of wasting prevention and treatment services. On this basis, the Nutrition Cluster partners in Afghanistan call for local civil society and the international community to commit to the Nutrition Cluster priorities outlined in the multi-sector humanitarian response plan to ensure that the nutritional needs of PiN can be met.
In situations like Afghanistan where recent and timely gold standard data sources are not available, a globally validated standard methodology and guideline for geographic prioritisation is required to support the better identification and targeting of locations with critical nutrition needs. This has relevance to the next iteration of the Nutrition Humanitarian Needs Analysis Guidance to come in 2021 (GNC 2020).
For more information, please contact Beka Teshome Bongassie at bekates@yahoo.com
1 Defined as people who are acutely malnourished and in need of lifesaving treatment or nutritional support within the year.
2 A fuller description of cGAM can be found in an earlier article in Field Exchange: https://www.ennonline.net/fex/61/gamafghanistan
4 In the absence of COVID-19 estimates at the time, and the lack of country-specific or regional data, estimations drawn from Ethiopia were used. Those were estimates for an emergency nutrition response in Somali region refugee camps during the 2012 drought to account for an increased burden of malnutrition.
5 The average increase for the 34 provinces was 15%. This is slightly higher than the Lancet paper global estimate of 14.3% increase in the prevalence of moderate or severe wasting among children younger than five years due to COVID-19 (https://www.thelancet.com/journals/lancet/article/PIIS0140-6736(20)31647-0/fulltext)
References
FSAC (2020) Afghanistan IPC Acute Food Insecurity Analysis April 2020 – November 2020, Issued in May 2020 - Afghanistan. Retrieved from
GNC (2020) Lessons Learned Workshop. Nutrition Humanitarian Needs Analysis Guidance Post Pilot. Retrived from
https://www.nutritioncluster.net/event_nuthumanitarianneedsanalysisWorkshop
Government of Afghanistan (2013) National Nutrition Survey Afghanistan (2013) | HumanitarianResponse. Retrieved from https://www.humanitarianresponse.info/en/operations/afghanistan/assessment/national-nutrition-survey-afghanistan-2013
IPC (2019) Acute Malnutrition Version 3 Guidance. Retrieved from http://www.ipcinfo.org/fileadmin/user_upload/ipcinfo/manual/IPC_Technical_Manual_3_Final.pdf
NSIA (2019) Afghanistan StatisticalYearbook 2018-19. Islamic Republic of Afghanistan, National Statistics and Information Authority. Issue No. 40. July 2109, retrieved at: https://www.nsia.gov.af:8080/wp-content/uploads/2019/11/Afghanistan-Statistical-Yearbook-2018-19_compressed.pdf
OCHA (2020) Internal Displacement due to Conflict | HumanitarianResponse. Retrieved from https://www.humanitarianresponse.info/en/operations/afghanistan/idps