
Affordable and nutritious child feeding in Nigeria: Applying Cost of the Diet modelling
Md Masud Rana is a Nutrition Advisor at Save the Children, UK
Gideon Luper Abako is a Nutrition Innovation Coordinator at Save the Children, Nigeria
Boluwatito Samuel is a Nutrition Specialist at Save the Children, Nigeria
Alabi Oluyomi is an Assessment and Research Manager at Save the Children, Nigeria
Key messages:
- This article explores a ‘Cost of the Diet (CotD)’ assessment, conducted in Nigeria in 2022, which identified the cheapest approaches to meet all the nutritional requirements of children aged 6-23 months throughout the year, from locally available and culturally acceptable food items.
- Markets had a diverse range of food items that could fulfil all major macro- and micronutrient requirements, indicating that the availability of nutrient-rich foods may not be the main barrier to a nutritious diet in this setting.
- The CotD assessment showed that a lowest-cost diet meeting energy, protein, fat and micronutrient specifications is expensive compared to the standard income of the target population.
Background
Due to the high prevalence of undernutrition, in 2019 the Government of Nigeria and the World Bank identified Oyo state in Southwestern Nigeria as one of the 12 highest-burden states in the country. Around 35% of children under five are stunted and 65% are anaemic. Six out of ten children do not receive a diverse diet, and nearly nine out of ten are not fed an appropriate number of meals for their age. Only 5.8% of children achieve a minimum acceptable diet (National Population Commission, 2019).
The Accelerating Nutrition Results in Nigeria (ANRiN) project is a GBP 202 million initiative of the Federal Government of Nigeria - financed by the International Development Association of the World Bank Group and the Global Financing Facility - to tackle malnutrition in the 12 highest-burden states in Nigeria. The project aims to improve maternal and child nutrition status by increasing access to, and utilisation of, Nigeria’s Basic Package of Nutrition Services. The package includes the promotion of infant and young child feeding practices through social and behaviour change communication activities. However, evidence suggests that economic constraints can limit the effectiveness and sustainability of such initiatives if nutritious foods are unavailable or too costly (Deptford et al, 2017). In addition, current complementary feeding recipes promoting dietary diversity tend to be generic and based on food groups rather than on actual nutritional content, cost and local food availability, as well as dietary preferences.
Study objectives
The CotD assessment in Oyo was conducted in 2022 to identify the cheapest approaches to meet all the nutritional requirements of children aged 6-23 months throughout the year, from locally available and culturally acceptable food items. Recipes would then be promoted through existing Mother Support Groups alongside Nigeria’s Basic Package of Nutrition Services.
The analysis also aimed to assess the degree to which economic constraints might affect poor and very poor households from accessing a nutritious diet. Specifically, this assessment set out to answer the following questions:
- What is the minimum cost of a nutritionally adequate and culturally acceptable diet for a typical household in Ogo Oluwa and Afijio local government areas (LGAs) of Oyo state?
- What locally available foods are inexpensive sources of essential nutrients and can be promoted through programme interventions?
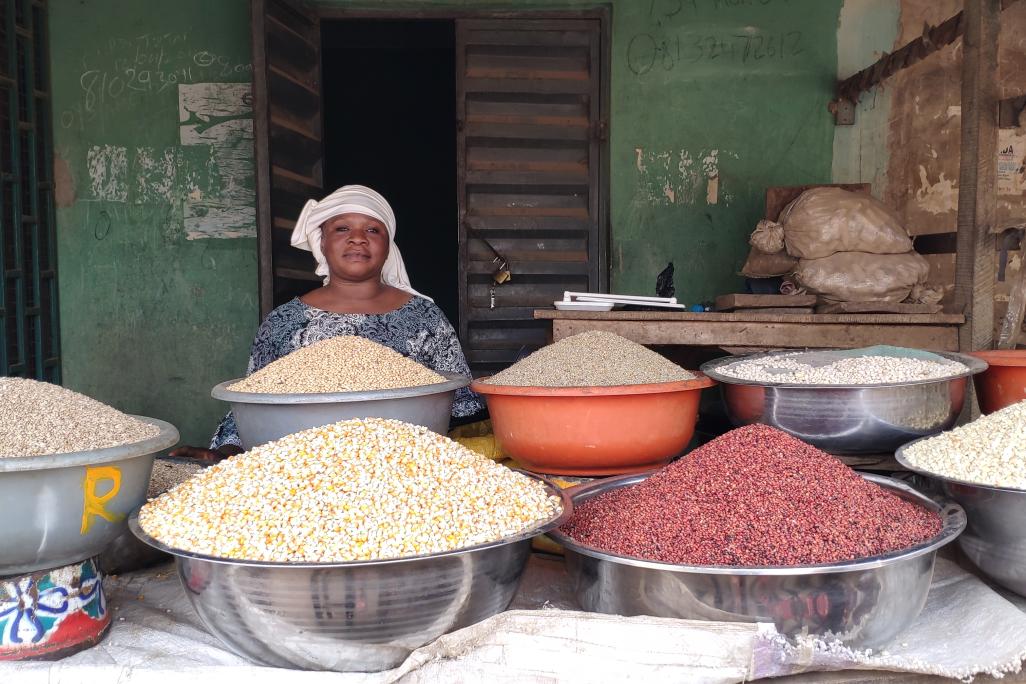
A trader selling food items in a rural market in Oyo state. Nigeria, 2022 © ANRiN Project, Save the Children Nigeria
Methods
A CotD analysis estimates the hypothetical minimum amount of money a typical household would need to purchase their recommended intakes of energy, protein, fat and micronutrients, using locally available foods. The software contains five databases: the energy and nutrient content of foods; the energy and nutrient requirements of individuals; predefined groups of individuals in typical households; the portion sizes of foods; and currency conversion factors (Deptford et al, 2017).
Primary data on food prices, seasonal food price variation, seasonal availability and local dietary habits were entered into a linear programming solver within the software. The CotD software, in combination with the internal databases, then estimated the cost, quantity and combination of local foods needed to provide target individuals and households with a diet that met average energy needs and recommended intakes of protein, fat and micronutrients. For this assessment, an average household size (n = 5) was calculated from ANRiN’s monitoring data.
Primary data collection for the CotD assessment involved surveys in selected markets and individual interviews and focus group discussions (FGDs) with neighbouring villages or communities. Primary data collection took place during January and February 2022 in Ogo Oluwa and Afijio LGAs within Oyo state, where Save the Children was already planning to implement the ANRiN Innovation project. In total, 10 markets and 10 villages (farming communities) were selected for primary data collection from a complete list of villages, with one additional market and one village selected for field practice. All 10 villages were within the catchment areas of the markets where market surveys were conducted.1
a) Market survey: The primary aim of the market survey was to record the prices and weights of food items found in the assessment area across various seasons. Real-time data on food prices were collected for the current season (dry season, lasting from November to March), while retrospective data were collected for the other two seasons (rainy season, lasting from August to October; lean season, lasting from April to July). Where possible, weight and price data were collected from four traders in each market.
b) Individual interviews: A food frequency questionnaire was administered to assess the consumption frequency (per week) of all food items on the market survey questionnaire, if available or in season. In each sample village, eight women (with children under two years of age, and who were also the primary food preparer in the household) were asked to participate in both individual interviews. In total, 80 individual interviews were conducted from 10 villages.
c) FGDs: The FGDs were conducted with the same groups of women who had taken part in the interviews using a semi-structured questionnaire to obtain insights into typical food consumption habits, cultural practices and food taboos in the assessment area. The discussions validated the interviews’ compiled responses, covering food preferences, taboos, beliefs, intra-household food distribution and access to markets, and homegrown/naturally available free food items.
Estimating different diets and their cost
The research team estimated the cost of four hypothetical diets using the above data and the CotD software for a typical five-person household (comprising one man, one breastfeeding mother, and three children, including one child aged 12-23 months):
a) A lowest-cost diet that only met recommended average energy requirements (energy only (EO) diet)
b) A lowest-cost diet that met specifications for energy, protein, fat and micronutrients but did not consider typical dietary habits (minimum-cost nutritious (NUT) diet)
c) A nutritious diet calculated by applying constraints at the time of analysis to include the staple foods and exclude taboo foods (staple-adjusted nutritious (SNUT) diet)
d) A lowest-cost diet that met specifications for energy, protein, fat and micronutrients and considered typical dietary habits and cultural acceptability (food habit nutritious (FHAB) diet)
Estimating the affordability of diets
While the minimum cost of a nutritious diet can be useful on its own, more insight is gained when comparing diet costs against the purchasing power of the target population. Diet affordability was estimated using income and expenditure data from a recent economic assessment in a neighbouring LGA to Oyo state (Okeleke et al, 2020). Annual non-food expenditure was taken as it was reported. For each wealth group (poor and affluent households), income and non-food expenditure data were entered into the CotD software to determine how affordable the diet was.
Limitations of the CotD software and method
While the CotD method and software are practical, powerful tools, it is important to consider the limitations of the analytical process and associated results.
- The software estimated diet is the hypothetical lowest-cost diet, which is applicable only for the family size (n = 5) and composition used in the calculation. Therefore, any results that extrapolate these findings to specific groups or individuals should be interpreted with caution.
- The method also excludes any additional energy, protein and nutrient requirements for sick or convalescing individuals due to insufficient data, highlighting the need for further caution.
- Although CotD software can identify a ‘diet’ that provides the recommended amounts of macro- and micronutrients from a relatively small sample of foods, it assumes that this particular diet will be consumed by each family member on a daily basis and at every meal, which is unlikely to be realistic.
- The CotD software also fails to consider the needs for several nutrients, including vitamin D, iodine, and essential amino and fatty acids. However, there is a rationale for excluding these nutrients: vitamin D is not included as requirements can be met when skin is exposed to ultra-violet light; iodine is not included as the amount present in foods is dependent on soil quality; and most food tables do not provide data on essential amino or fatty acids.
- When interpreting CotD results, it is also critical to consider intra-household food distribution. The software determines the amount of food for a family based on the sum of recommended nutrient intakes, but food is often distributed within a household based on individual needs - and not always equitably (Berti, 2012; Harris-Fry et al, 2017).
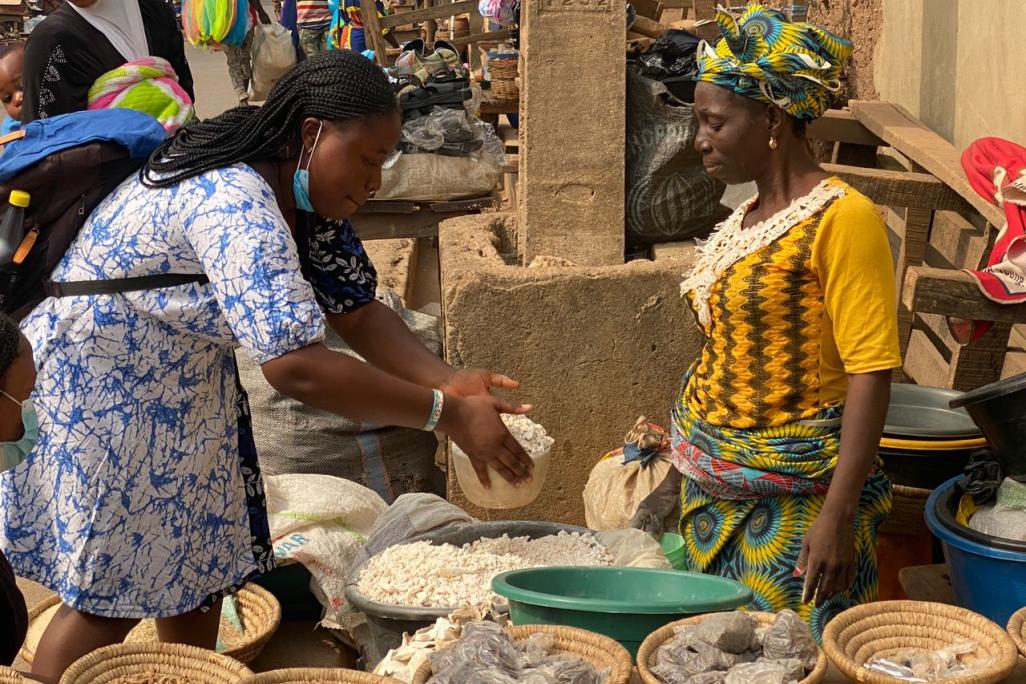
Conducting a market survey in Oyo state. Nigeria, 2022 © ANRiN Project, Save the Children Nigeria
Key findings
Food availability and consumption patterns
The market survey found 182 food items in the assessment area when combining all three seasons: 33 cereal or grain-based products; 15 types of root and tuber; 18 types of legume, nut and seed; 9 meat and offal products; 17 types of fish or seafood; 24 vegetables; and 25 fruits/fruit products.
The interviews and FGDs conducted in the 10 villages confirmed that yam, cassava and maize were the main staple foods. Although rice and wheat (mainly used to make bread) were also commonly consumed and available in the market, they were comparatively more expensive and thus less frequently consumed than the alternatives. Most households consumed two to three meals a day on average throughout the year, with some impoverished households having only one or two meals a day. However, there were some differences between the seasons: three meals were usually consumed during dry seasons, whereas only two meals were consumed during rainy or lean periods.
The most common food for children under the age of two was ‘pap’, a soft, watery food prepared from maize mixed with sugar and milk or water. There were no specific taboos observed for this age group. Breastmilk was given to children under the age of two, but exclusive breastfeeding was not often practised.2 Alongside breastmilk, common foods for children were ewedu (a savoury soup made of leafy vegetables, most commonly of jute leaves), mashed beans, noodles and cassava flour. Fish, milk and eggs were rarely given to children due to the prohibitive cost.
The study found that the lowest cost of meeting just the EO requirement of a typical five-member household was NGN 226,388 (USD 500) per year (Figure 1). The annual cost of a diet that met the needs for energy and micronutrients but did not consider typical dietary practices (the NUT diet) was NGN 406,820 (USD 900). The annual cost of the SNUT and FHAB diets was around NGN 826,110 (USD 1,830) and NGN 1,096,073 (USD 2,430) respectively. Within the household, the cost of meeting the nutritional requirements of breastfeeding women was highest (27% of household spend), followed by the requirements of men (25%), of children aged 11-12 (24%), of children aged 9-10 (19%) and of children aged 12-23 months (5%).
The FHAB diet included 43 food items from 12 different food groups available in the markets. Yam (tuber or flour) was identified as the primary staple that constituted 26% of overall cost, meeting 28% and 16% of energy and protein requirements respectively, along with other micronutrient needs. Overall, markets in the study area had a diverse range of food items that could fulfil all major macro- and micronutrient requirements. While this analysis did not identify any limiting nutrients in the assessment zone, calcium and iron were found to be the most difficult to obtain (i.e., the most significant cost driver), followed by pantothenic acid (B5) and vitamin B12.
Figure 1: The annual cost of various diet types for a standard household with five members
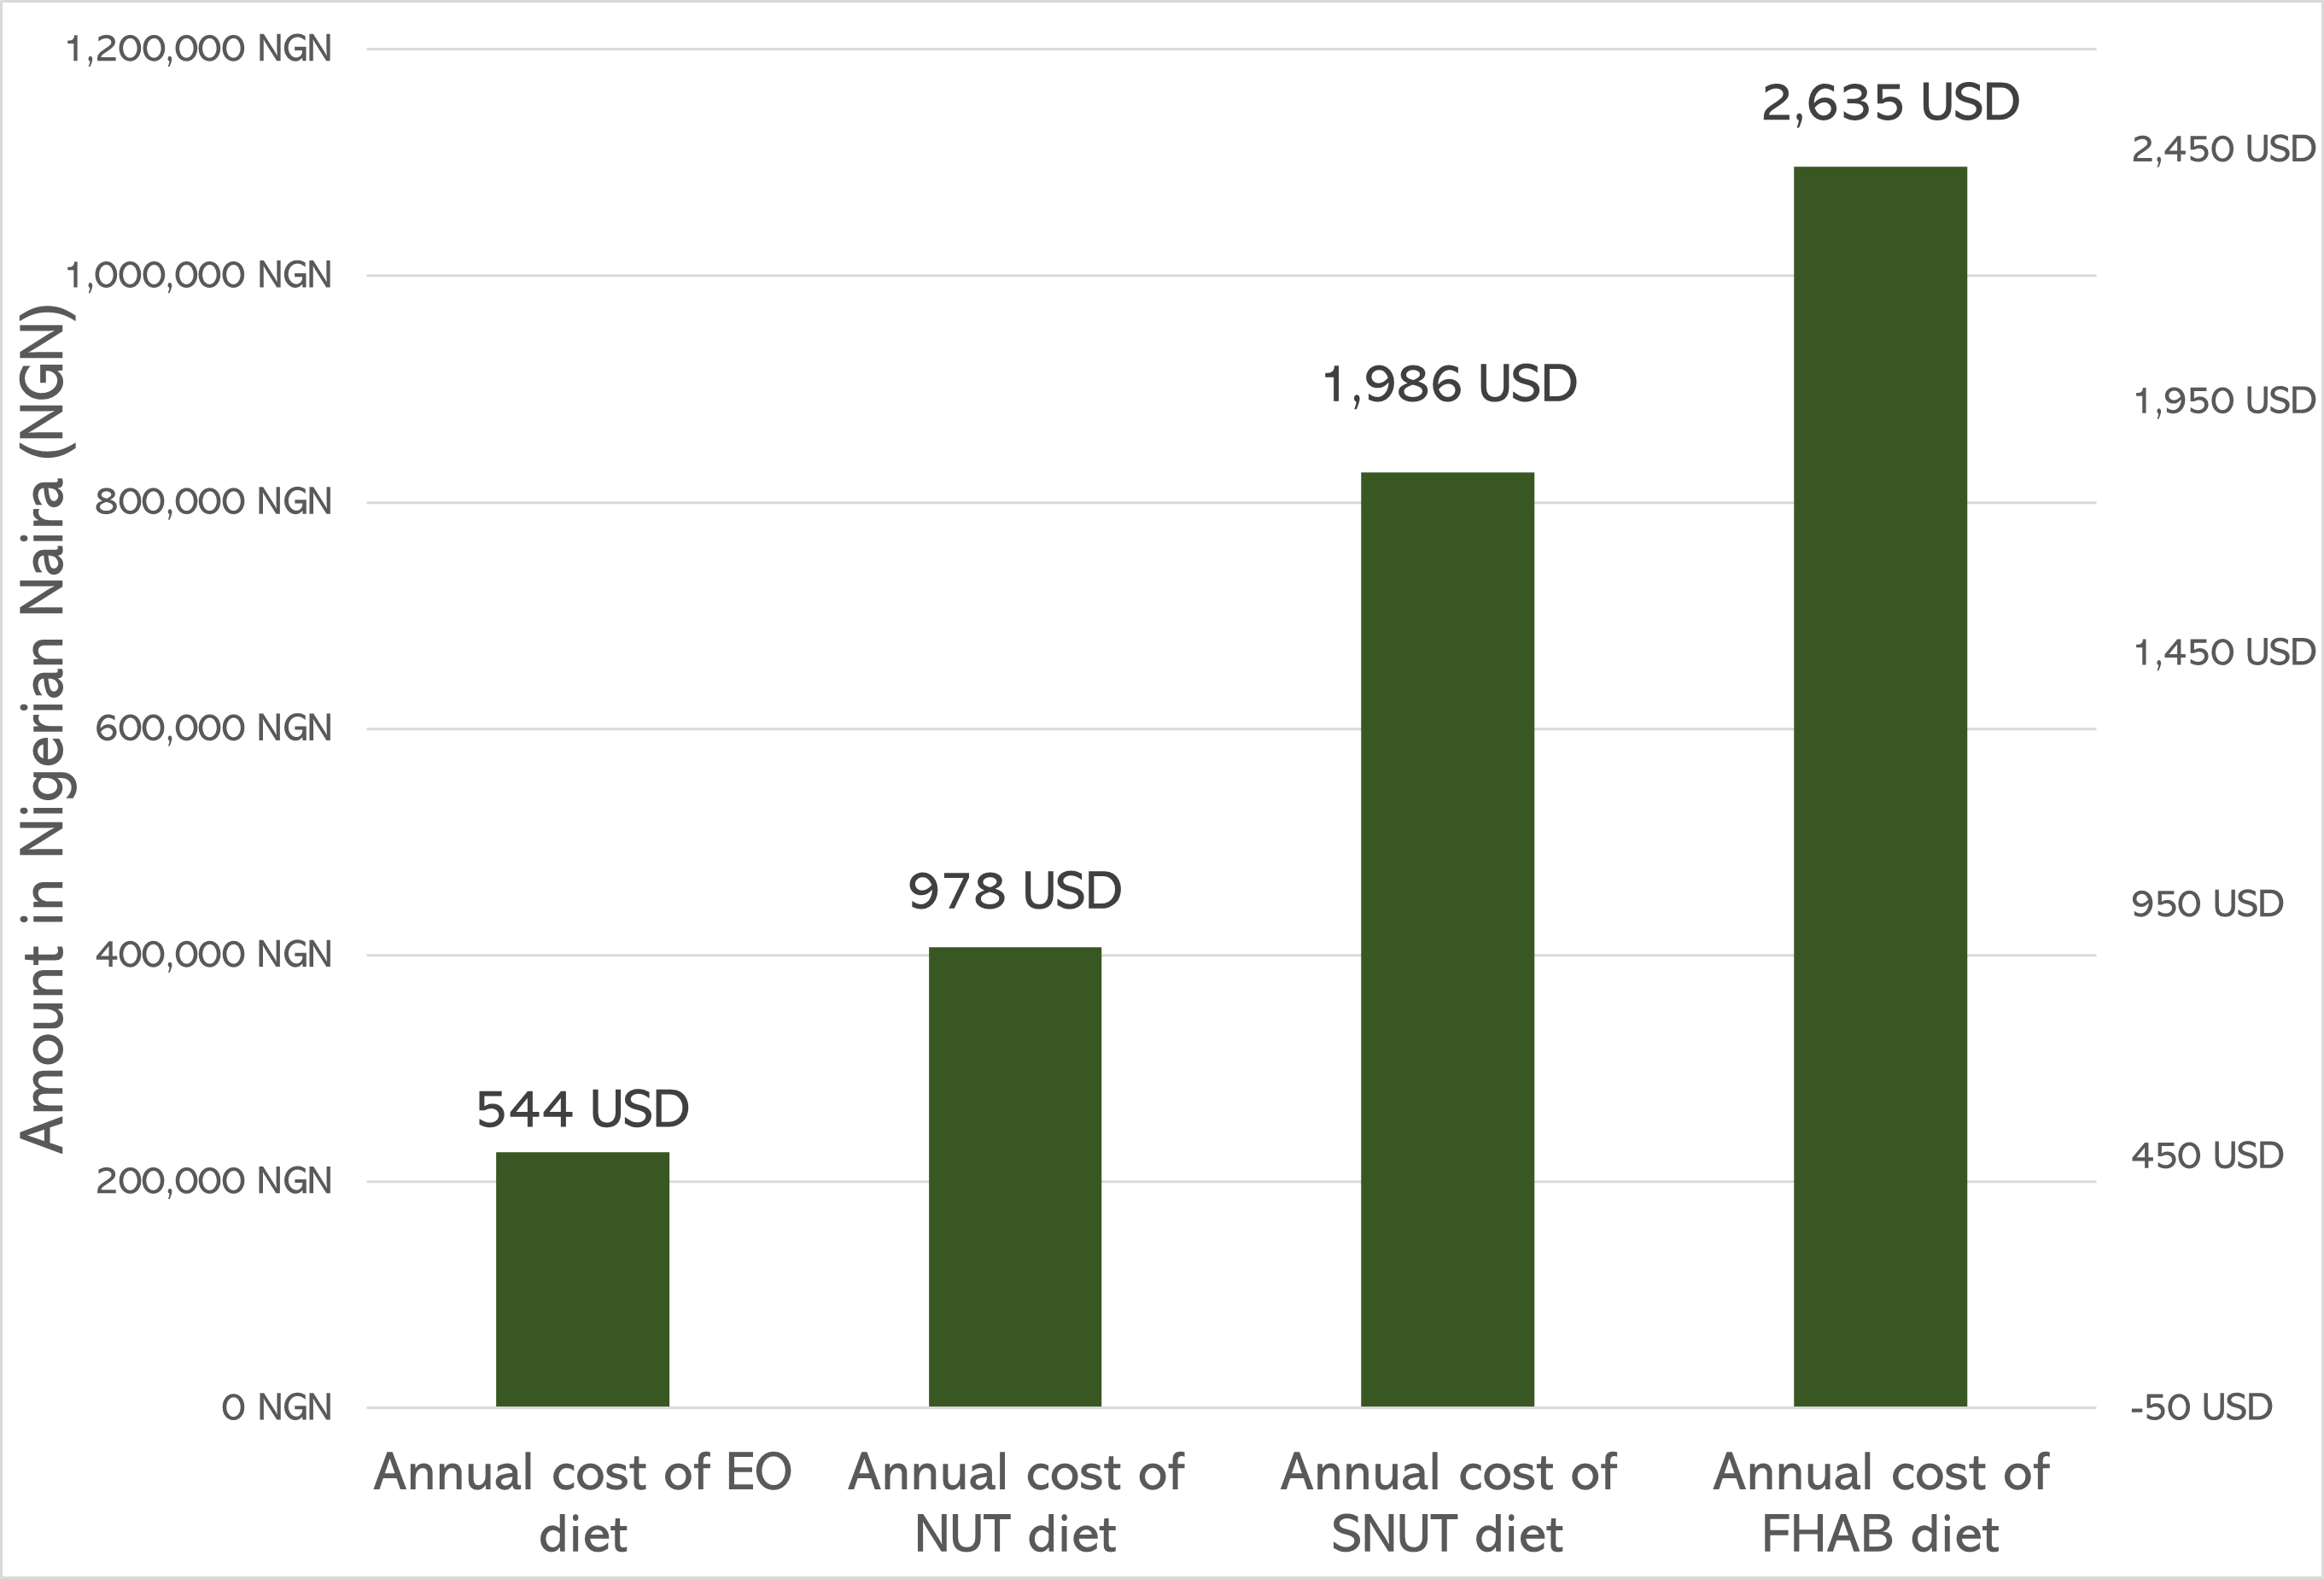
Abbreviations: EO - energy only diet; FHAB - food habit nutritious diet; NUT - minimum-cost nutritious diet; SNUT - staple-adjusted nutritious diet.
The results from the affordability analysis (Table 1) indicate that poor rural households from farming communities may be unable to afford a FHAB diet plus non-food expenditure. This implies that poor households can only afford to purchase a portion of FHAB after meeting their non-food expenditure. As per the affordability calculation, poor households can only afford to meet energy requirements and non-food expenditure with their current income level. Therefore, poor rural households have a shortfall of NGN 53,771 (USD 120), NGN 475,500 (USD 1,055) and NGN 745,463 (USD 1,650) from being able to afford a NUT, SNUT and FHAB diet respectively. Conversely, wealthier households with an income in line with the national annual minimum wage (NGN 1,651,200 (USD 3,660)) can afford both the FHAB diet and non-food expenditure, with a predicted surplus of NGN 241,515 (USD 535).
Table 1: Estimated affordability of different diet types and non-food expenditure by household types (poor vs affluent)
Formula | Poor households | Affluent households | |
Annual household income | 664,222 | 1,651,200 | |
Non-food expenditure | 313,612 | 313,612 | |
Income: non-food expenditure | (a) | 350,610 | 1,337,588 |
|
|
| |
Cost of EO diet | (b) | 226,004 | 226,004 |
Excess or shortfall | (a) - (b) | 124,606 | 1,111,584 |
|
|
| |
Cost of NUT diet | (c) | 404,381 | 404,381 |
Excess or shortfall | (a) - (c) | -53,771 | 933,207 |
|
|
| |
Cost of SNUT diet | (d) | 826,110 | 826,110 |
Excess or shortfall | (a) - (d) | - 475,500 | 511,478 |
|
|
| |
Cost of FHAB diet | (e) | 1,096,073 | 1,096,073 |
Excess or shortfall | (a) - (e) | -745,463 | 241,515 |
* All the numbers (income, expenditure, cost of diets and excess or shortfall) in the table above are in NGN
Nutritious diet ‘what if’ modelling
Using CotD software, three hypothetical ‘what if’ scenarios were modelled to examine the effects on the cost, composition, quality and affordability of the diet of poor households:
- Introducing moringa leaves (i.e., drumstick leaves) for one of three meals a day, only during the dry season, as a free food (Model 1)
- Promoting the consumption of sweet potatoes once a week, during all seasons, as an alternative to the other commonly consumed roots/tubers (Model 2)
- Introducing both interventions together (Model 3)
Moringa leaves are abundant in communities, as shown by around half of the interviewed mothers reporting their consumption, yet they are only consumed sporadically. It can therefore be leveraged as a more consistent and cheaper source of nutrients. If moringa leaves were consumed more frequently (Model 1), the annual cost of the FHAB diet for the entire family would be reduced from NGN 1,096,073 (USD 2,430) to NGN 880,801 (USD 1,950) - a 20% reduction. On an individual level, the cost of a nutritious diet for breastfeeding mothers could be reduced by 17%. For children under the age of two, the reduction could be up to 36% (Figure 2).
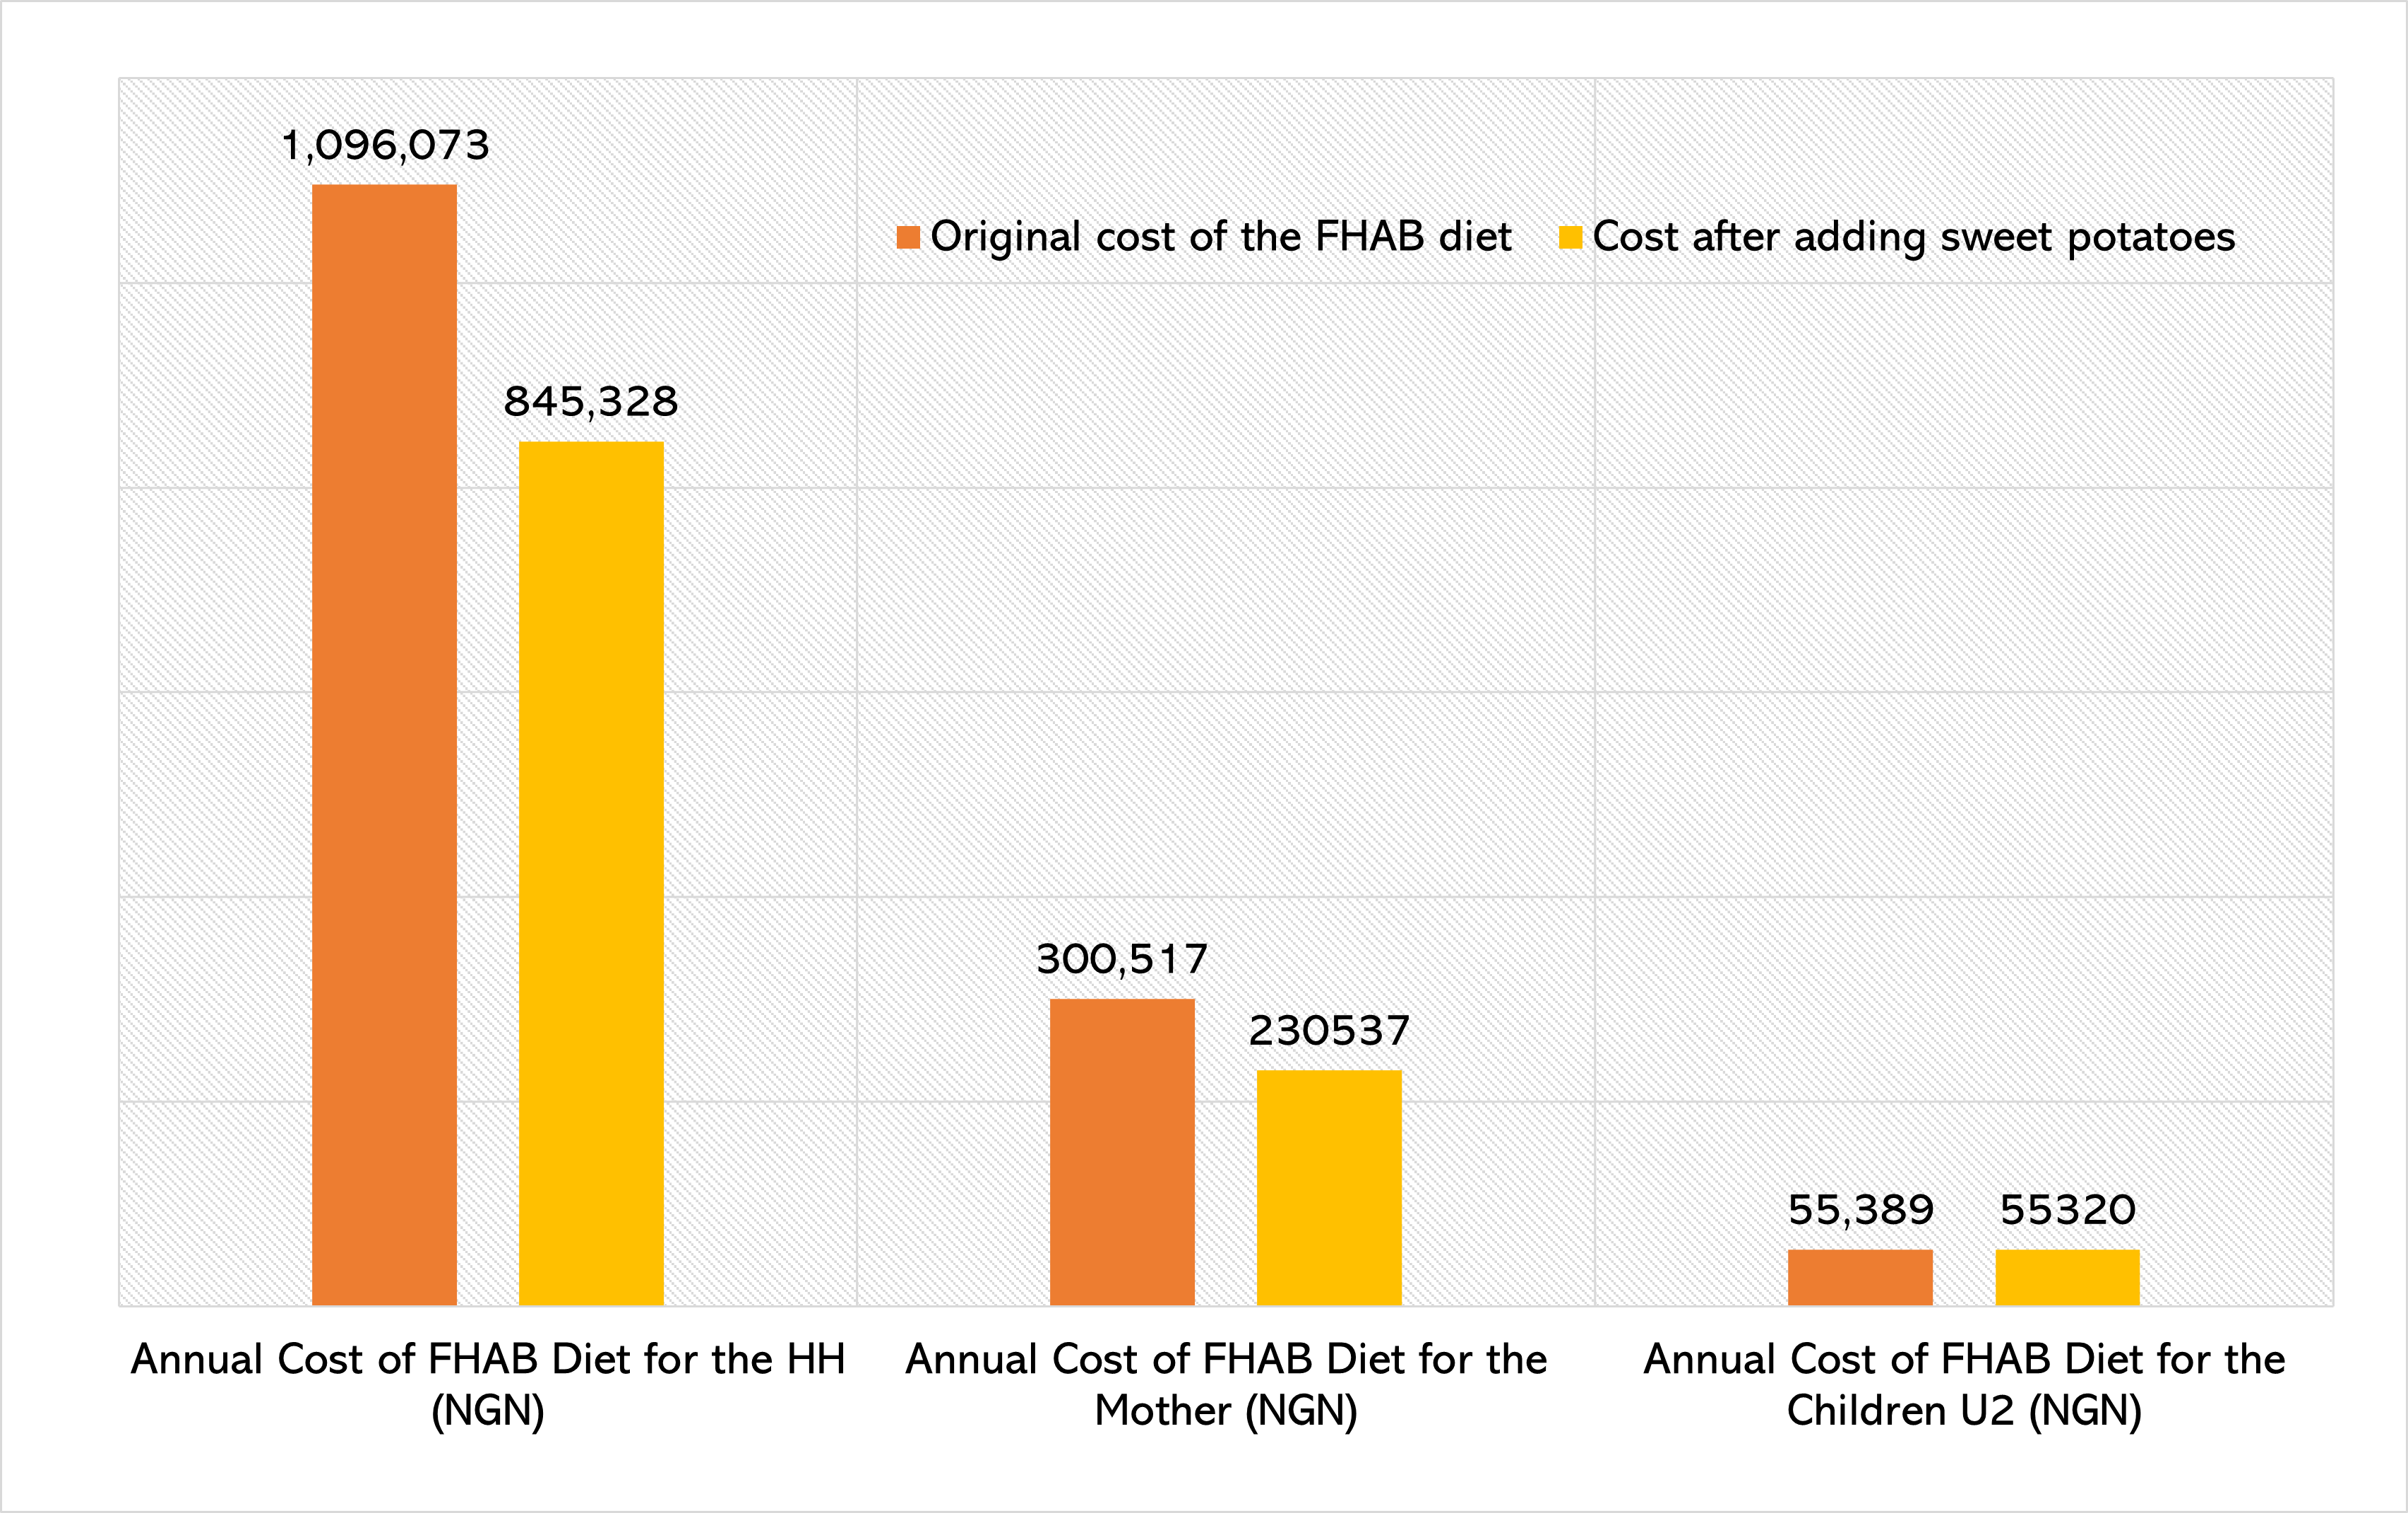
Similarly, if poor households replaced a portion of yam flour and grated cassava (garri) in their diet with sweet potatoes (Model 2), the annual cost of the FHAB diet for the entire family would be reduced from NGN 1,096,073 (USD 2,430) to NGN 845,328 (USD 1,870) - a 23% reduction. The cost of a nutritious diet for breastfeeding mothers could be reduced by 23%, but this has little impact on children’s diets (Figure 3).
Figure 2: Effects on the CotD of a poor household when increasing moringa leaf (as free food) consumption during the dry season
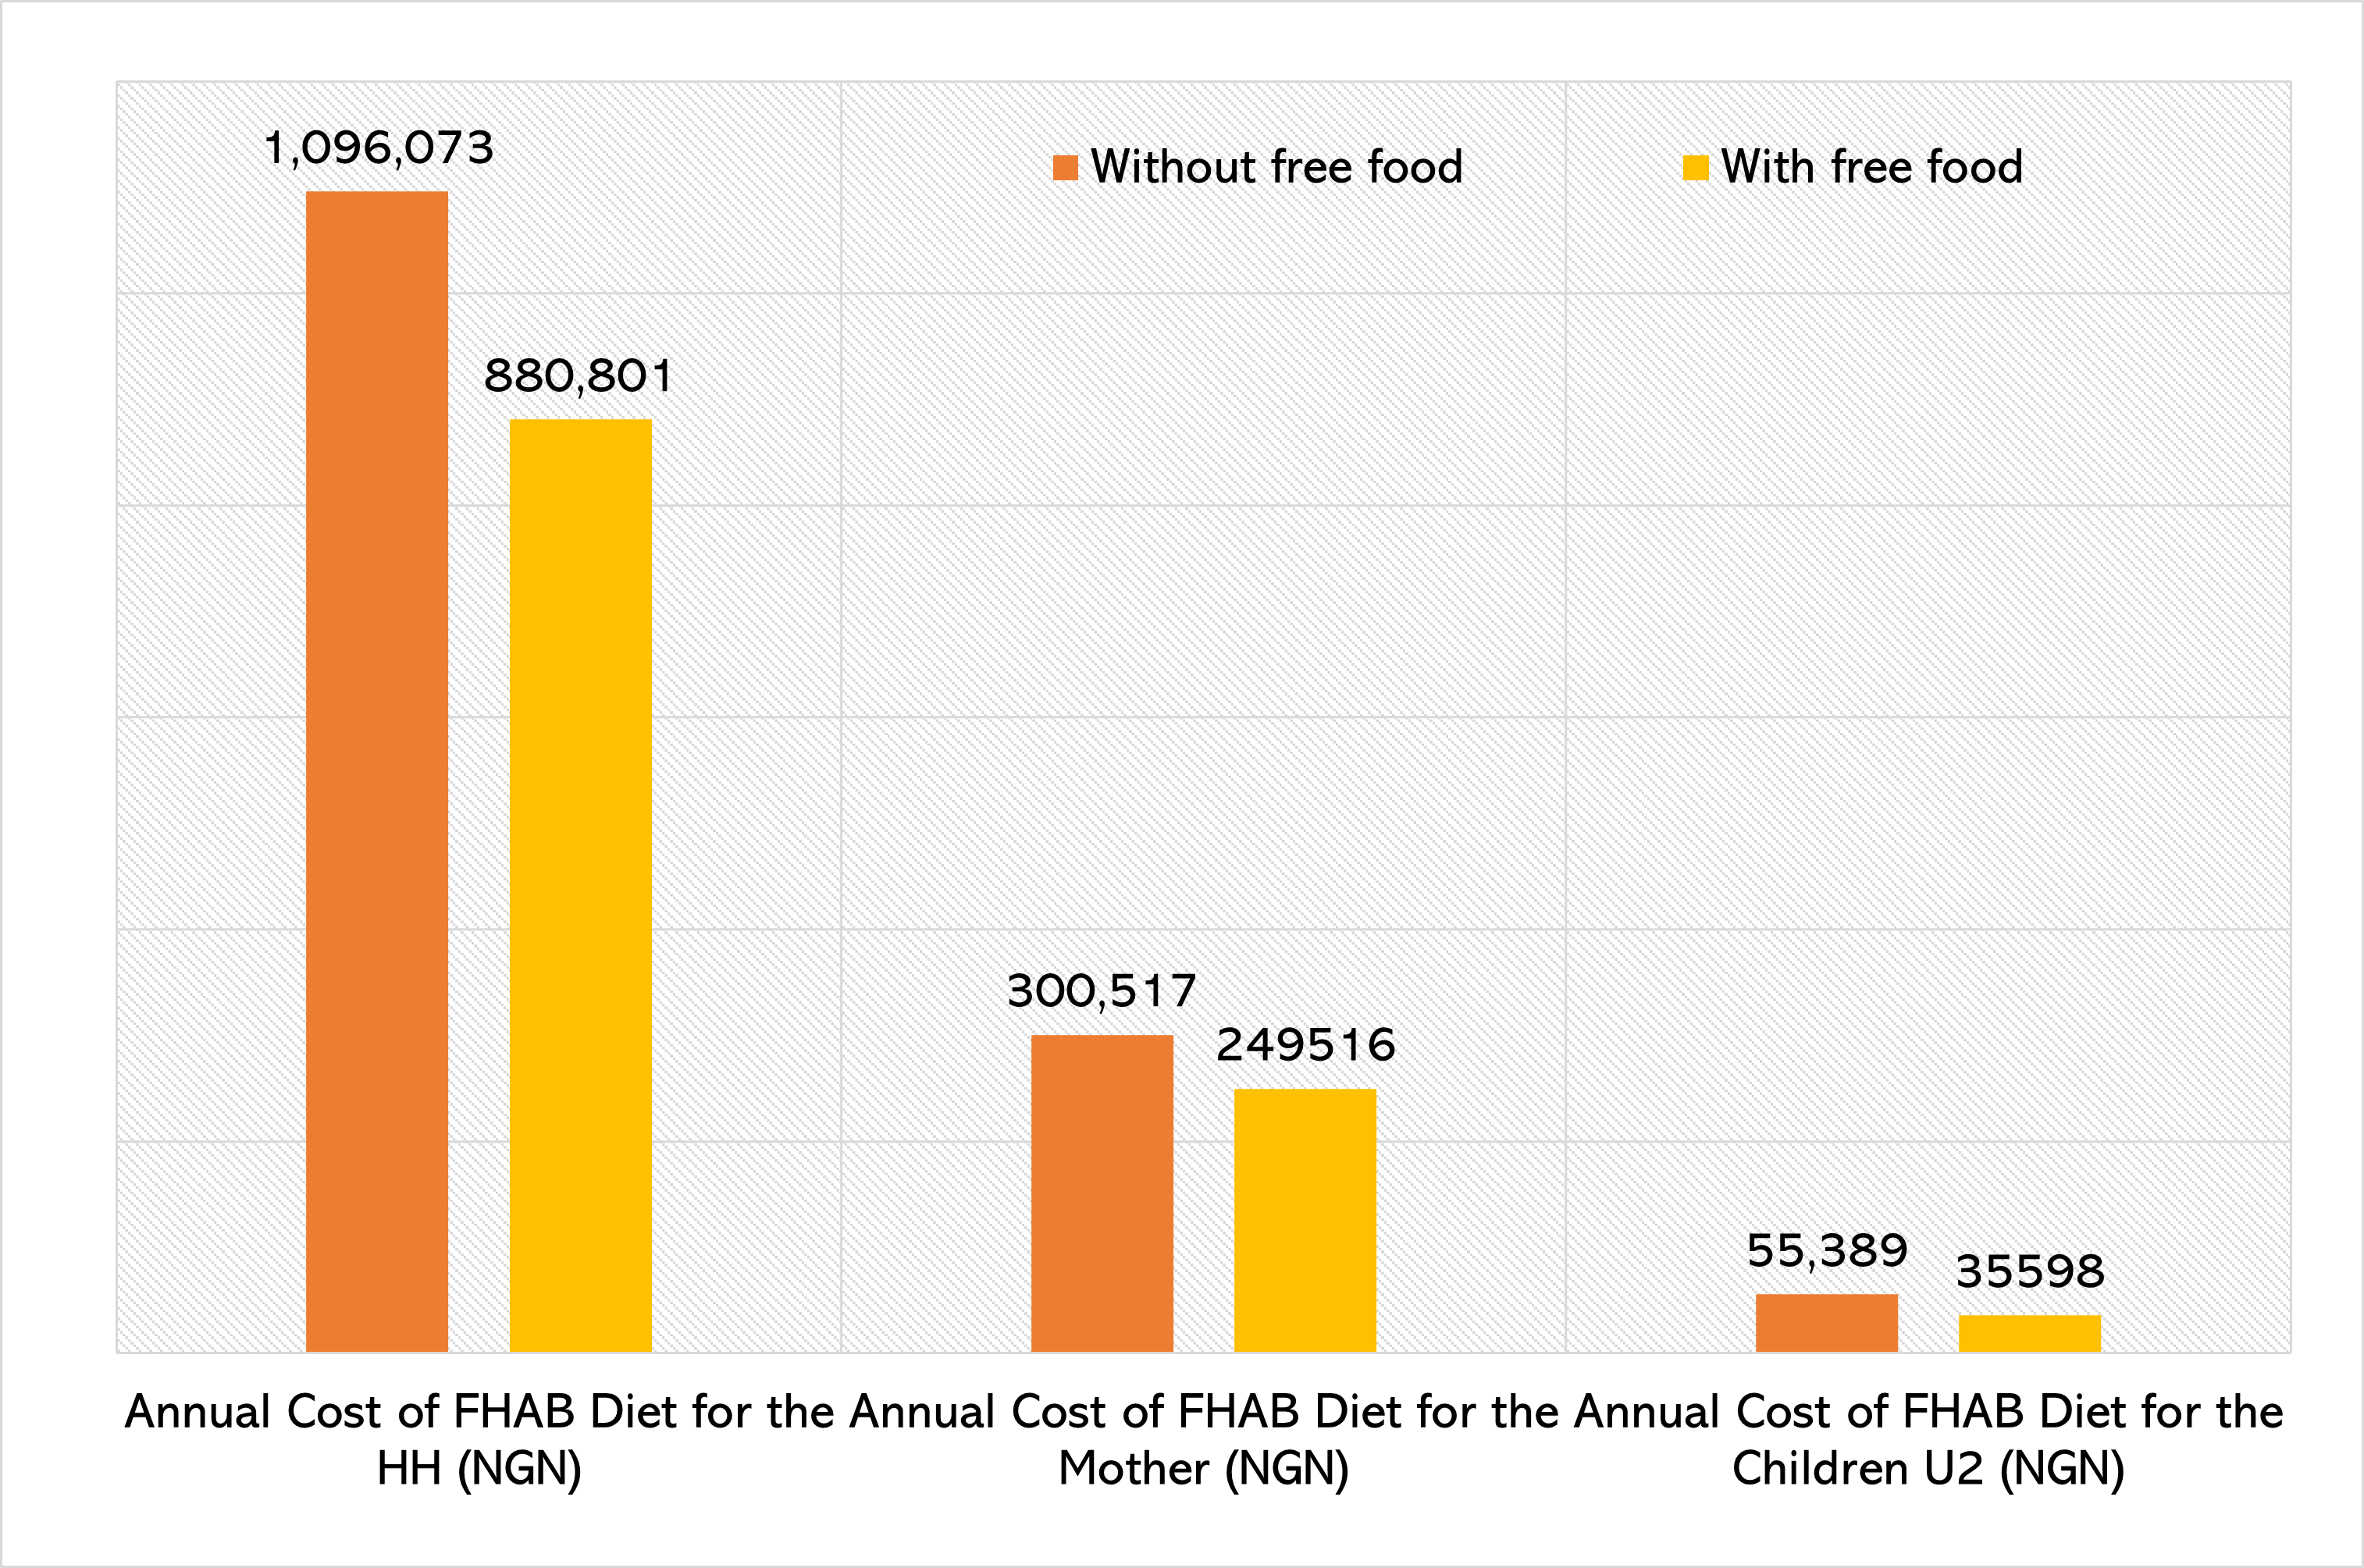
Figure 3: Effects on the CotD of a poor household when increasing (orange-fleshed) sweet potato consumption
If a typical poor household adopted both of the previous practices (Model 3), the annual cost of the FHAB diet for the entire family would be reduced from NGN 1,096,073 (USD 2,430) to NGN 630,612 (USD 1,395) - a 42% reduction. On an individual level, the cost of a nutritious diet for breastfeeding mothers could be reduced by 40%. For children under the age of two, the reduction could be up to 36%.
Development of recipes
The CotD assessment also found that the cost of a nutritious diet can be significantly reduced by incorporating underutilised nutritious, but cheap or free, food into the local diet. The analysis of different diet types presented by the software revealed 12 highly nutritious, but cheap and underutilised, food sources: sweet potatoes, maise, cassava, moringa leaves and pods (free), Malabar spinach (free), citrus fruits, sorghum, African cherry, cashew nuts, wheat bran, dried coconut kernel and amaranth leaf.
To improve the child feeding practices and to promote affordable complementary food among the marginalised farming communities, the ANRiN project team developed a recipe book comprised of 20 low-cost, nutritious recipes based on food items identified by the CotD analysis, considering the availability, price and nutrient content of all food items, as well as food preferences and dietary practices. All the recipes were developed with the active participation of community members of Ogo Oluwa and Afijio LGAs.
Conclusion
Although the FHAB diet was 2.7 times more expensive than the NUT diet, food items selected for the FHAB diet were still some of the cheapest options in the markets. Nevertheless, the CotD assessment showed that the cost of a FHAB diet remained high compared to the standard income of the target population. Households in the study area were unable to afford both nutritious food and non-food items, with an average ‘poor’ family expressing an affordability gap of around 120% of their income.
Overall, markets in the study area had a diverse range of food items that could fulfil all major macro- and micronutrient requirements. Based on this finding, we conclude that the availability of nutrient-rich foods is not the main barrier to typically poor households obtaining a nutritious diet. These results appear to justify the aim of the ANRiN project to enhance children’s nutritional status by reducing affordability gaps through the development and promotion of low-cost, nutrient-dense recipes. This study demonstrates the way the CotD method and software can be used, not only to understand the extent to which economic constraints may affect an individual’s or household’s ability to meet the nutritional requirements of the mother and children, but also to develop tools, such as the recipe booklet, which could significantly improve maternal and child nutrition during the first 1,000 days.
For more information, please contact Md Masud Rana at M.Rana@savethechildren.org.uk
References
Berti P (2012) Intrahousehold distribution of food: A review of the literature and discussion of the implications for food fortification programs. Food and Nutrition Bulletin, 33, 3, S141-251. https://journals.sagepub.com/doi/epdf/10.1177/15648265120333S204
Deptford A, Allieri T, Childs R et al (2017) Cost of the Diet: A method and software to calculate the lowest cost of meeting recommended intakes of energy and nutrients from local foods. BMC Nutrition, 3, 1. https://doi.org/10.1186/s40795-017-0136-4
Harris-Fry H, Shrestha N, Costello A et al (2017) Determinants of intra-household food allocation between adults in South Asia - A systematic review. International Journal for Equity in Health, 16, 1. https://doi.org/10.1186/s12939-017-0603-1
National Population Commission (2019) Nigeria Demographic and Health Survey 2018. https://www.dhsprogram.com/pubs/pdf/FR359/FR359.pdf
Okeleke S, Oluwalana T & Akinbosoye T (2020) Determinants of expenditure pattern of rural households in Akinyele Local Government Area, Oyo state. Direct Research Journal of Social Science and Educational Studies, 7, 7, 206-211.
1 A map of the study locations can be accessed here: https://www.google.com/maps/d/u/0/edit?mid=1uPLHFCoNSJHxm9nFxmj4I6VaTLciOuuM&ll=8.107971704197201%2C4.03234752382811&z=10.
2 Children under the age of six months were not the primary targets for this study, although this group were often mentioned during FGDs regarding child feeding practices. For the purposes of this analysis, all children under the age of six months were assumed to be exclusively breastfed.