
The effect of age rounding on weight-for-age z-scores: Evidence from Sub-Saharan Africa
Ifrah Fayyaz is a Healthcare Data Analyst at Milliman.
Zachary Tausanovitch is a Data Science Lead (Nutrition) at International Rescue Committee (IRC).
Binta Coulibaly is a Monitoring, Evaluation and Learning Officer at IRC.
Sharon Ogai is a Nutrition Data Information Officer at IRC.
Angela Kithua is a Senior Nutrition Officer at IRC.
Elizabeth Radin is the Director of Health Policy and Communication at IRC.
Background
What we know: As children grow, even small variations in age estimation can dramatically affect their anthropometric indices. It is therefore important to collect accurate age measurements in humanitarian and development settings for effective triage and treatment.
What this adds: This article explores how the imprecise reporting of age data presents significant barriers to the classification of malnutrition status by weight-for-age z-scores. In Mali, Chad, and Kenya, age rounding by caregivers may have biased underweight estimates, resulting in under-/over-diagnosis and extended or reduced treatment.
Children aged 6–59 months are classified as malnourished when their weight-for-age z-score (WAZ) is lower than minus two standard deviations (< -2 SD) below the median on the 2006 World Health Organization growth standards (WHO, 2006).
Some researchers have proposed using severe underweight (WAZ < -3 SD) as an entry criterion for therapeutic feeding programmes in this age group, due to an increased mortality risk among these patients (Bailey et al, 2021; Khara et al, 2023). However, in populations with a high prevalence of underweight, it is often difficult to ascertain precise birth dates due to a lack of official documentation, low-literacy rates, and inaccuracies in recall data (Oshaug et al, 1994).
In many contexts, there may be a tendency to round ages to the nearest whole year, and sometimes half year (SMART, 2017). Such imprecision in age reporting could result in a miscalculation of WAZ – which is sensitive to the significant growth changes that occur in children under five years – increasing the risk of under- or over-diagnosis of severe underweight. This could then result in the provision of treatment to patients at lower risk of mortality (reducing cost-efficiency), while failing to provide treatment to patients with a higher risk of mortality (reducing treatment effectiveness).
In this article, we estimate the magnitude and frequency of age misreporting by analysing the distribution of reported ages in a large operational cohort study (n= 68,444) from Mali, Chad, and Kenya.
We assess the possible implications for under- or over-prescribing of ready-to-use therapeutic food if WAZ became an entry criterion in wasting treatment programmes. We further estimate the total misclassification that would result if age were routinely over- or under-recorded and the differential effects for children of different age groups.
Programme Description
Our data were collected through three operational pilot programmes that treated children with wasting using a simplified combined community-based management of acute malnutrition protocol based on the ComPAS trials.1 All patients in these programmes had ages based on caregiver recall.
The programmes were implemented by the IRC’s Airbel Impact Lab, in partnership with each country’s Ministry of Health. While the dosage and length of stay varied for each country, there were only two variations in admission criteria: either children were admitted if their Mid-Upper Arm Circumference (MUAC) was < 125mm, or if their weight for height z-score was <-2SD.
Although programme staff were instructed to collect children’s age in all programmes, anthropometric data were often missing due to COVID-19 safety protocols and MUAC-based programmes no longer requiring weight or height measurements. In every programme, socio-demographic data were collected upon admission and required anthropometric data were collected at every visit.
Methods
Estimating the scale of age rounding
To determine if significant age rounding occurred, we plotted the distribution of patient ages across all four programmes. We then estimated the percentage of patients that would report as a whole number year based on a uniform distribution and on a normal distribution.
To determine what a programme that used documentation looks like, we observed the distribution of ages from data in ComPAS (Bailey et al, 2021) for 2,315 patients in Kenya and South Sudan who provided birth documentation.
Estimating the scale of mis-categorisation induced by age rounding
We considered the difference between the observed frequency of rounded ages, and the expected frequency in normal, uniform, and observed distributions. We then conducted a sensitivity analysis – modelling the impact of different magnitudes of age rounding on WAZ scores – if WAZ < -3 SD had been used as an entry criterion for therapeutic feeding programmes. We also show WAZ < -2 SD and < -1 SD to demonstrate the shifting distributions.
To estimate the effect that rounding would have, we adjusted the age of every child who was identified as being in a whole number year by a fixed value, between -6 and +6 months. We then calculated the percentage of children that would qualify for each level of treatment under a WAZ criterion. By pursuing this methodology for every child, we roughly estimated the chance of mis-categorisation at admission depending on the number of months the age was rounded. We limited ourselves to +/- 6 months, assuming that rounding was done to the nearest year.
Results
We included 66,712 children who had weight, height, and age measurements in this analysis. Of the 1,732 that were not included, 342 were excluded due to missing weight. This was due to the preferential use of MUAC and/or community health worker admissions during the height of the COVID-19 pandemic. The remaining exclusions (n=1,390) were due to data collection issues in Chad that resulted in missing age or sex.
Staff relied on caregiver recall when estimating a child’s age as few clients provided documentation. Although age was requested in months, we found that caregivers were more likely to report an age on a six-month increment, with the frequency at which children were reported in these age groups suggesting that there was significant age rounding upon reporting.
To better understand the risk of misclassification and to estimate the magnitude of the problem, we assessed the frequency and magnitude of age misreporting in the large operational cohort. As a comparison to our results, we use separate data collected from the ComPAS trial in South Sudan and Kenya, where ages were collected based on birth dates verified by documentation (Figure 1). Only 8.1% of the sample was an exact year value when rounded to the nearest month (Bailey et al, 2021), resulting in a relatively smooth distribution throughout.
In a uniformly distributed population within the range 6–60 months, 9% of the sample should report age as a multiple of 12 months. In our data, there is noticeable heaping at 12, 24, 36, 48, and 60 months – over 30% of the entire sample. This suggests that approximately 22% of the full sample was affected by rounding (Figure 2) and therefore highlights the imprecision in computed anthropometric measures involving age.
Figure 1: Age at admission for children with birth records that corroborate their age
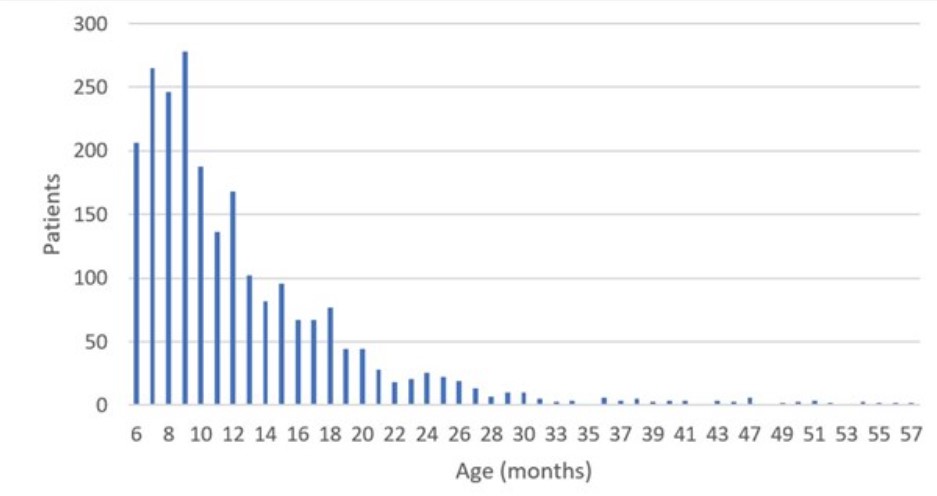
*Data from Bailey et al. (2021), South Sudan and Kenya (N = 2,315)
Figure 2: Reported age at admission by caregivers without birth records
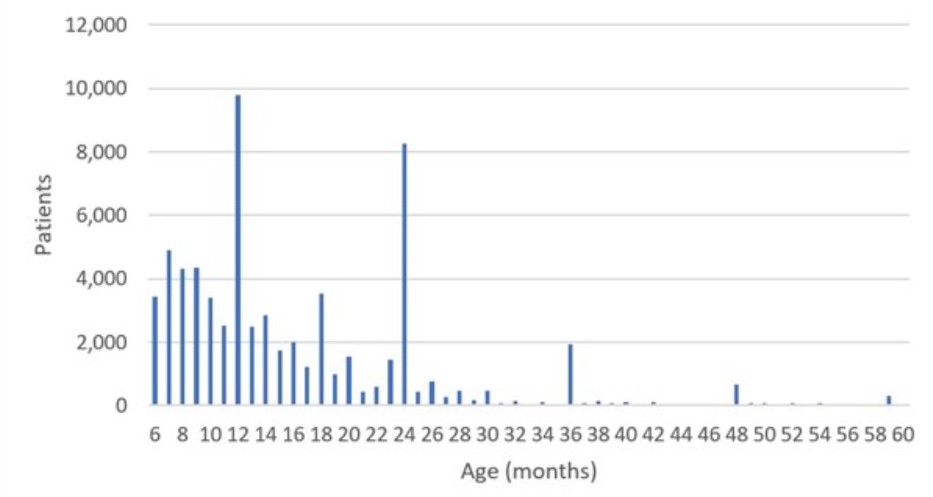
*Data from IRC pilot programmes in Kenya, Mali, and Chad (N = 66,712)
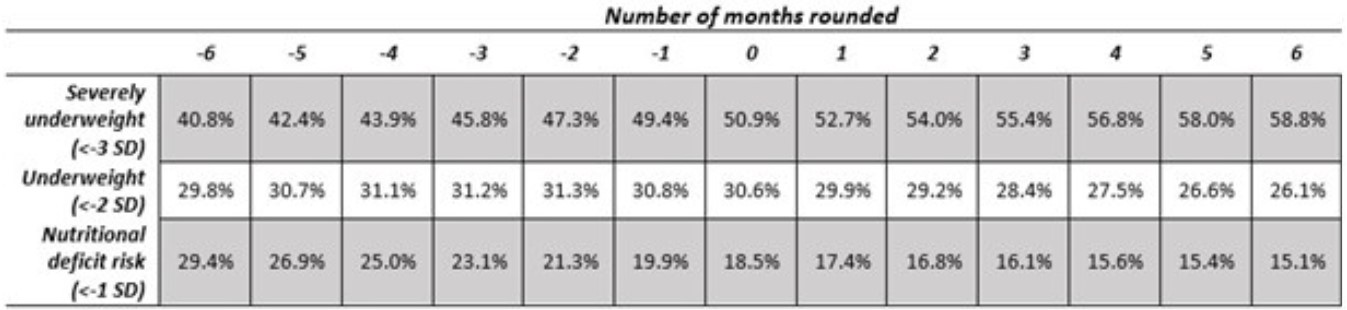
Table 1 indicates that 40.8% or 58.8% of patients would be eligible for severe underweight treatment if rounded up or down, respectively.
Assuming an average rounding of +/- 6 months, almost 20% of all patients who would arrive at health centres under a low-WAZ criterion could be misclassified in the four specified programme areas if we were to accept their reported age at face value. Similarly, age rounding would result in approximately 14% of patients being misclassified as having nutritional deficit risk (WAZ <-1). Overall, if therapeutic feeding programmes were to consider low WAZ as an admission criterion, the age rounding could easily result in treatment being refused to underweight patients, or provision of treatment to non-underweight children at a similar rate.
Table 1: Weight-for-age sensitivity analysis – Estimated full sample underweight prevalence, according to degree of age rounding
Lessons Learned
The mis-categorisation of patients due to age rounding could represent a significant cost to programming (treating patients that should not qualify) and a significant risk to children (who would not be treated that would otherwise qualify).
Using exact birthdays (Figure 1) appears to mitigate this issue entirely – highlighting a clear opportunity. Unfortunately, this policy is not enacted in many health centres due to a lack of documentation and reliance on recall from caregivers. In some contexts, such as the Hagadera refugee camp in Dadaab, Kenya, documentation is provided by a camp interview and is itself subject to caregiver recall.
Other methods have been used for mitigating this issue, such as the proper use of event calendars to aid caregivers in determining the approximate month of the child’s birth. The SMART Methodology identifies that improper administration of events calendars can also lead to age heaping.
Spending more time questioning caregivers that provide an exact year age to increase their specificity is another approach that could be considered. There could also be opportunities to better link growth monitoring programmes and therapeutic treatment programmes in areas that offer such programmes as a way of improving age estimates.
As our criterion were not age dependent, it is likely that staff put less emphasis on correct age identification. This same analysis would need to be repeated in a similar setting where age is an admission criterion to see enumerators more successfully identify age.
While our data is limited to four sub-Saharan African contexts, these data are compelling and we have seen similar trends in DHS data (Lyons-Amos and Stones, 2017), as well as with other measurements (Perumal et al, 2020).
Older patients’ z-scores are less elastic toward single month changes in age due to a wider distribution. However, older patients also experience more heaping on years versus half-years, which suggests higher average number of months rounded per patients. That said, we also consider that younger age groups face the highest risk of mortality associated with underweight (Thurstans, 2023). The opposing direction of these effects merits additional research as older patients may be more misclassified compared to younger patients but may also experience lower risk generally.
Conclusion
We have observed that inaccurately rounding ages even by a few months could lead to biased underweight estimates, resulting in under-/over-diagnosis and extended or reduced treatment.
Our results recognise the problems associated with the inaccurate measurement of age in surveys or interventions designed in low-income settings, calling for further research and improvement in the following three arenas: (i) increased use of algorithms that estimate age heaping, such as the Emergency Nutrition Assessment software that is provided by SMART, to inform monitoring efforts of data quality; (ii) refining methods and tools to improve the accuracy of age reporting, including recording children’s age to the nearest month using event calendars; and (iii) provision of more intensive training to enumerators to highlight the importance of age identification. The latter two techniques could be implemented in routine programming while correction algorithms are only helpful for post-estimation.
While these changes may improve measurement of age, there may also be additional consequences to algorithmic checking and additional questioning of caretakers. Additional oversight of staff can lead to incentives to adjust admission statistics to fit the expected pattern, especially when low admission numbers can lead to surprising distributions at the health centre level. Additional questioning of caretakers without birth records could turn mothers away, make them reluctant to share additional information with health centre staff, or increase the time that caretakers need to wait for treatment.
We have shown that lack of proper documentation and birth records significantly reduces measurement accuracy and may have many additional downstream effects for any programme that uses WAZ in their admission and discharge criteria. Directly related to this research we have found that, unless a context has access to accurate birthdate records, further work is recommended before implementing a WAZ-based admission protocol or any other age-based treatment or risk assessment. Given that low WAZ is a significant predictor of mortality risk, and that age does appear to be accurately measured through documentation, the ideal solution may be to advocate for all countries and communities to implement birth certificates to eliminate the need for the proposed imperfect solutions.
For more information, please contact Zachary Tausanovitch at zachary.tausanovitch@rescue.org.
References
Bailey J, Lelijveld N, Khara T et al (2021) Response to malnutrition treatment in low weight-for-age children: Secondary analyses of children 6–59 months in the ComPAS cluster randomized controlled trial. Nutrients, 13, 4, 1054.
Khara T, Myatt M, Sadler K et al (2023) Anthropometric criteria for best-identifying children at high risk of mortality: A pooled analysis of twelve cohorts. Public Health Nutrition, 26, 4, 1–17.
Lyons-Amos M and Stones T (2017) Trends in Demographic and Health Survey data quality: An analysis of age heaping over time in 34 countries in Sub Saharan Africa between 1987 and 2015. BMC Research Notes 10, 760.
Oshaug A, Pedersen J, Diarra M et al (1994) Problems and pitfalls in the use of estimated age in anthropometric measurements of children from 6 to 60 months of age: A case from Mali. The Journal of Nutrition, 124, 5, 636–644.
Perumal N, Namaste S, Qamar H et al (2020) Anthropometric data quality assessment in multisurvey studies of child growth, The American Journal of Clinical Nutrition, Volume 112, 806S–815S.
SMART (2017) SMART Methodology Manual 2.0. smartmethodology.org.
Thurstans S, Wrottesley S, Fenn B et al (2023) Anthropometric deficits and the associated risk of death by age and sex in children aged 6–59 months: A meta-analysis. Maternal & Child Nutrition, 19, 1, e13431.
WHO Multicentre Growth Reference Study Group (2006) Assessment of differences in linear growth among populations in the WHO multicentre growth reference study. Acta Paediatrica S450, 56–65.