Identifying underweight infants and children using a novel “MAMI” slide chart
This is a summary of the following article: Monga M, Sikorski C, de Silva H et al. (2023) Identifying underweight in infants and children using growth charts, lookup tables and a novel “MAMI” slide chart: A cross-over diagnostic and acceptability study. PLOS Global Public Health, 3, 8, e0002303. https://journals.plos.org/globalpublichealth/article?id=10.1371/journal.pgph.0002303
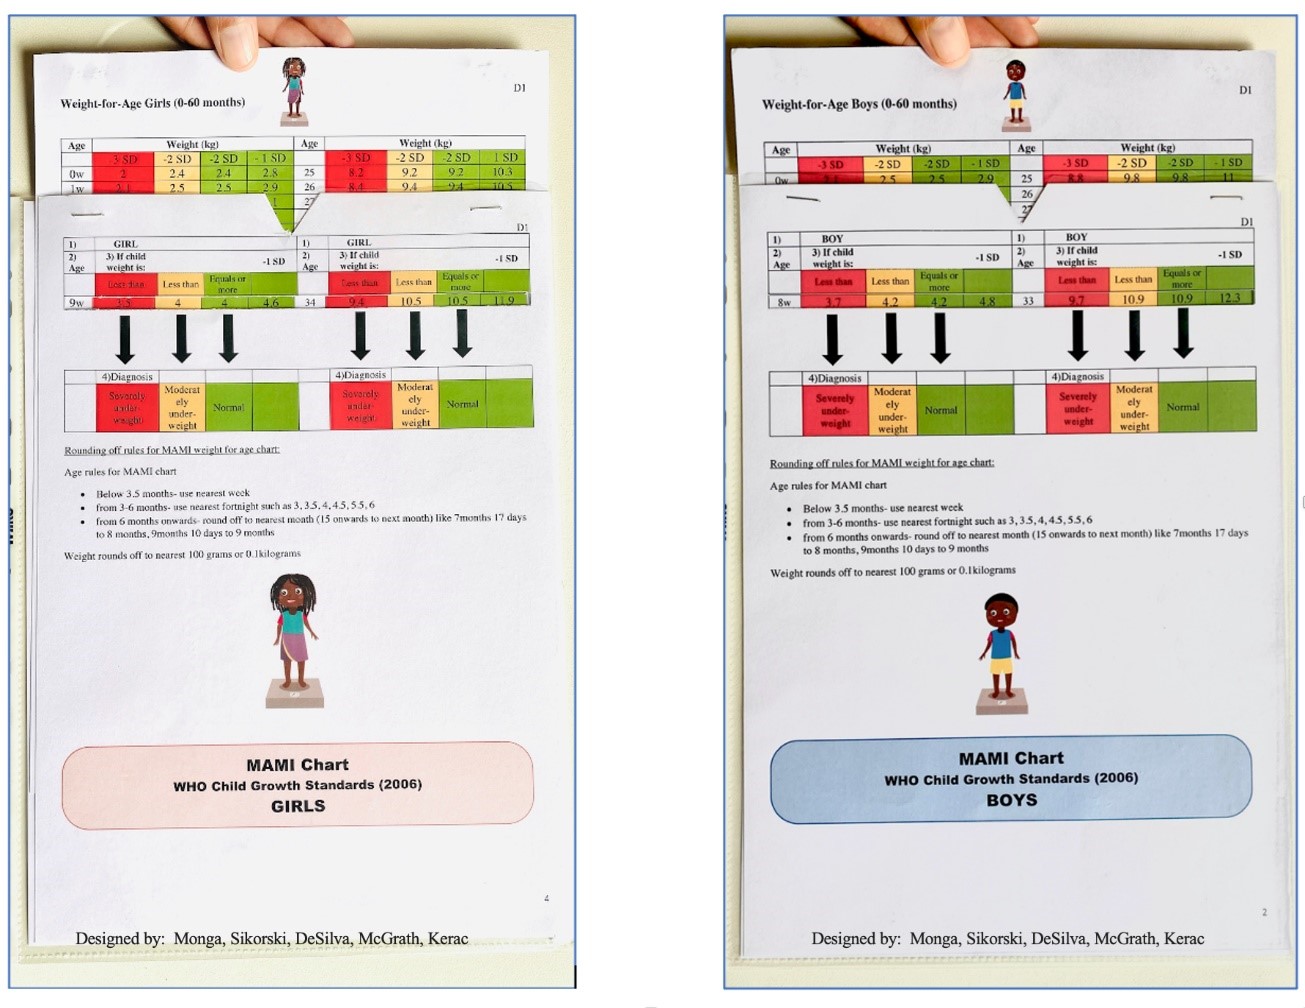
Using weight-for-age (WFA) as a malnutrition indicator offers several advantages compared to other methods and it is the best indicator of mortality risk for infants aged under six months. However, this method is prone to errors in practice. Building on previous work, the researchers developed a low-cost tool – the ”œMAMI chart” – which was designed to improve the accessibility and accuracy of WFA assessment (Figure 1).
Figure 1: The ”œMAMI chart” front and reverse sides

This study measured how accurately 62 public health/nutrition workers and students could classify 25 hypothetical scenarios where a child’s sex, weight, and age were presented – determining whether they were normal weight, moderately underweight, or severely underweight under timed conditions. Participants acted as their own controls by testing the ”œMAMI chart”, then World Health Organization growth charts and lookup tables in a random order.
The ”œMAMI chart” had the highest diagnostic accuracy of the three assessments (79%), with lookup tables (70%) and growth charts (61%) performing worse (p<0.01). This difference in accuracy was clinically as well as statistically significant in terms of numbers of infants being correctly identified to receive appropriate treatment. Moreover, most participants reported that they preferred using the ”œMAMI chart” as it was easier than traditional methods.
The study featured an appropriate sample size calculation based on previous, comparable studies, but the sample size was smaller than the ideal target due to logistical constraints. This may have left this study underpowered, based on the anticipated effect size, but this issue was negated given that the overall effect size was larger than expected.
The study utilised a robust cross-over study design that eliminated many confounding variables. The sample was comprised mostly of students (45%) and doctors (39%), with 77% of participants having 0–5 years of experience in nutrition or public health. Although the results were comparable across different experience levels, the use of early-career professionals makes it difficult to extrapolate these findings to a broader population. It was also not possible to blind the study participants, which may have introduced bias into the findings.
Although the hypothetical, time-pressured research setting simulated real-world conditions – where clinicians often face large caseloads – the diagnostic accuracies observed are likely to differ from a more natural setting. The values themselves may therefore be of limited use, but the percentage difference between these assessments is important to consider. In this case, the findings indicate that this novel slide chart makes WFA assessment quicker and easier for a relatively inexperienced group of public health professionals. More work is needed to test this tool in different settings, but these findings are promising. The relative inaccuracy of the two existing assessment methods highlights the need for improved training and supervision.


