
Streamlining SMART survey processes in support of a high quality, nationally owned nutrition information system in Kenya
Streamlining SMART survey processes in support of a high quality, nationally owned nutrition information system in Kenya
By Lydia Ndung’u, Lucy Maina-Gathigi, Lucy Kinyua, Hassan Ali Ahmed, Kibet Chirchir and Samuel Mahinda Murage
Lydia Ndung’u is a public health nutritionist, currently working as SMART advisor for East Africa, Southern Africa and Yemen. Lydia has over 10 years of extensive experience in managing, implementing and evaluating programmes in Africa in humanitarian and development contexts for both government and non-governmental organisations.
Lucy Maina-Gathigi is a nutrition officer with UNICEF Kenya, specialising in nutrition information systems. She is the co-chair of the Kenya Nutrition Information Technical Working Group and holds an MSc in Applied Epidemiology and a BSc in Food Nutrition and Dietetics.
Lucy Kinyua is a nutritionist working with the Kenyan Ministry of Health as a monitoring and evaluation manager and is the secretary of the Nutrition Information Technical Working Group. She holds an MSc in Applied Human Nutrition.
Hassan Ali Ahmed is the Associate Director for Nutrition at Action Against Hunger Canada and a lead for the Global SMART Initiative. He has worked with Action Against Hunger since 2014 in emergency contexts before joining the SMART global project in Jordan. Hassan holds an MBA in Strategic Management from the University of Nairobi.
Kibet Chirchir is a public health and monitoring and evaluation practitioner, currently working for the United Nations Office for Project Services (UNOPS) as a Nutrition Support Officer, strengthening nutrition information systems at national and sub-national levels in Kenya.
Samuel Mahinda Murage is a Health Records and Information Officer working with the Kenyan Ministry of Health. He has over 20 years of experience working in various levels of the healthcare system from service delivery to the policy level.
The authors recognise the leadership and commitment of the Government of Kenya at national and county levels in improving the quality of the Nutrition Information System. In particular, the authors express sincere thanks to Veronica Kirogo, Head Division of Nutrition and Dietetics, Ministry of Health, for her leadership and guidance as well as to the Nutrition Information Technical Working Group (NITWG) members and their respective agencies, including Action Against Hunger Kenya and World Vision for their tenures as NITWG chair. The authors also recognise UNICEF and other partners for the financial support towards integrated SMART surveys and Action Against Hunger Canada which has acted as the SMART Project Convenor since 2009.
The views of Lucy Maina-Gathigi and Kibet Chirchir incorporated in this article are their own and do not necessarily represent the views of UNICEF, its executive directors or the countries that they represent and should not be attributed to them.
Location: Kenya
What we know: Standardized Monitoring and Assessment of Relief and Transitions (SMART) methodology is widely used in Kenya by governments and partners, in both arid and semi-arid areas, in nutrition surveillance and early warning systems.
What this article adds: From 2013 onwards, the processes for conducting SMART surveys in Kenya were streamlined, harmonised and institutionalised under the coordination and leadership of the national Nutrition Information Technical Working Group (NITWG). Key actions to streamline processes included the development of guidelines and standard processes, capacity building, the development of task forces, the setting up of systems to validate all survey methods pre-survey and preliminary results post-survey and the management of a common data repository. The result of these actions has been increased capacity among government staff at both national and county level, improved capacity for the coordination of resource mobilisation and joint planning and survey training. Overall results achieved are the greater national ownership of survey management and results (including greater government funding), government-led survey implementation, data that is comparable over time and between geographic areas and the use of data to inform timely nutrition actions as well as to inform other sectors and the overall situation analysis in the country. Key drivers of this success include the commitment to capacitate national staff at all levels, succession planning, consistent stakeholder communication and the availability of complementary data for situations (such as in COVID-19) when SMART surveys could not be undertaken.
Background
Kenya has set out a vision to transform into a globally competitive and prosperous nation with a high quality of life by 2030. Poor health and nutrition status are major setbacks towards realising this vision, with huge disparities in the distribution of malnutrition observed across the country (Figure 1). The nutrition situation quickly deteriorates during drought periods in many parts of Kenya with critical and extremely critical levels of undernutrition regularly recorded in arid counties (Turkana, Mandera, Wajir and parts of Marsabit counties). A national Nutrition Information System (NIS) is critical to providing up to date nutrition surveillance and monitoring information to inform a timely, high quality nutrition response.
Figure 1: Prevalence of wasting in children 6-59 months across Kenya 47 counties

Source: Kenya Demographic and Health Survey, 2014
In recent years, the Kenya NIS has been better defined, as represented in Figure 2 and clear guidelines, tools and standardised methodologies and processes have been developed to support national nutrition monitoring and evaluation. Data sources for key indicators have also been better defined and nutrition Standardized Monitoring and Assessment of Relief and Transitions) (SMART) surveys have been identified as the key source of data on the prevalence of acute malnutrition at population level (Box 1).
Figure 2: The Kenya Nutrition Information System

Box 1: SMART survey methodology
Launched in 2002 by a network of organisations and humanitarian practitioners, SMART survey methodology1 is widely accepted within the nutrition community for use in all settings (development, emergency, displaced populations) for assessing the prevalence of different types of malnutrition and/or the nutritional impact of a project.
The methodology was originally developed as a tool to improve the monitoring, reporting and evaluation of humanitarian interventions. It has a strong focus on ensuring high quality data by controlling the quality of data collection, entry and analysis. SMART methodology was designed to address issues of common interest to many organisations working in humanitarian assistance including the need to i) standardise survey methodologies among organisations conducting nutrition surveys, ii) strengthen the technical capacity of all partners with user-friendly tools and iii) establish comprehensive, collaborative systems to ensure good quality and reliable data is used for reporting and decision-making.
In Kenya, SMART methodology was first implemented in 2008. Since then, many surveys have been conducted, especially during emergencies, as part of surveillance and to inform response and, in recent years, in non-emergency contexts. Prior to 2013, surveys were largely financed, technically supported and conducted by international partners, often with the support of international consultants from UNICEF or other implementing partners, with minimum government involvement. This led to a lack of standardisation in processes, methodologies, tools and indicators as consultants and agencies worked with their own interpretations. For example, there was no guidance on the number of indicators to be added to SMART surveys2 which led to compromised quality of anthropometric data and/or to the collection of indicators without an adequate sample size to inform programming. This article describes the processes undertaken in Kenya to streamline SMART survey processes to contribute to a high quality, nationally-owned and led NIS.
Establishing mechanisms for coordination and quality assurance
The 2007/2008 emergency situation triggered by the post-election violence (PEV) in Kenya demonstrated a heightened need to better coordinate information systems in order to ensure a more effective response. After reviewing lessons learned from the evaluation of the PEV response, the nutrition sector formed the Kenya Nutrition Technical Forum led by the Ministry of Health (MoH), under which several technical working groups were formed, including the Nutrition Information Technical Working Group (NITWG), set up in 2008. The agreed role of the NITWG was to review and validate data collection methodologies to ensure the availability of timely, quality nutrition information to guide programme response. The functions of the NITWG have since expanded to ensure the establishment and sustainability of a functional NIS through the actualisation of strategic objectives #9 and #10 of the National Nutrition Action Plan 2012-2017 to strengthen nutrition surveillance, monitoring and evaluation systems and to enhance evidence-based decision-making.3
Due to the varied capacities and skills within the NITWG, different task forces were formed based on the group's needs and in line with its terms of reference including SMART surveys, coverage, infant and young child feeding assessments and routine information task forces among others. The main objectives of the task forces were to fast-track protocol approvals, validate results and build the capacity of the NITWG members and affiliates in each respective area.
Since 2013, the NITWG has carried out annual nutrition ‘data clinics’ as part of its quality assurance activities. The main objective of these clinics is to critically review all nutrition indicators across every source of nutrition information (SMART surveys, routine health information system, sentinel sites), standardise tools and methods and provide guidance to all key partners and stakeholders. A secondary objective is to strengthen linkages with other working groups to improve data collection, analysis and dissemination, including partners from other sectors (Water, sanitation and hygiene (WASH), food security and health).
Actions to improve SMART surveys
A key function of the NITWG has been to improve the quality of the data collected through SMART surveys across Kenya. To this end, several important actions have happened since 2013 as follows:
Mapping partners and needs
The NITWG supported counties to carry out an inventory of NIS related capacity strengthening, support and resource mobilisation actions carried out by partners to enable joint coordination and planning. The NITWG also supported counties to map out surveillance needs, including when and where SMART surveys should be conducted, based on the mapping of seasonality and trend analysis. This resulted in a survey calendar to support better coordination and reduce duplication of partner activity. This process also considered the importance of linking with other sectors and aligning with other key assessments to ensure the optimal use of data, for example to allow the results of SMART surveys to feed into seasonal assessments.
Developing guidelines and standardising processes
To ensure the standardisation of all surveys at the national and county level, guidelines and global standards were adapted and contextualised to the Kenya context. This included the development of standardised versions of the questionnaires (available in different formats to accommodate both paper-based and mobile data collection), survey protocols, preliminary findings and reports. As surveys were implemented by multiple organisations with the support of multiple consultants, it was important to give clear guidance, for example, on the maximum number of indicators to add to the integrated SMART survey questionnaire, and to give a clear definition of each indicator and how to collect against it to avoid individual interpretation of methods. This clear guidance aimed to avoid historical poor practice, for example, one 2012 multi-sector survey included 130 questions leading to survey team and respondent fatigue, thereby compromising the data quality against core nutrition indicators. The NITWG team also developed templates for reporting preliminary results to guide stakeholders and to ensure that results were submitted for validation in standard formats.
Capacity building activities
Training on SMART surveys was carried out in 2014 and 2015 with support from the UNICEF regional office. A cascade approach was used to reach the field level government staff implementing surveys with a focus on the ASAL areas. This ensured the standardisation of methods used. As an example, Turkana county authorities initiated a targeted county level training that focused on government and partner staff directly involved in the implementation of a planned survey, thus giving trainees theoretical knowledge as well as practical experience.
Validating survey methods and results
To ensure the quality and standardisation of nutrition surveys, the NITWG has also put in place a system to review and approve survey methodologies ahead of survey implementation. This applies to all surveys and must be done before any fieldwork begins. It includes a review of the survey’s objectives, rationale, methodology, training plans (days, venue, topics, facilitators), data collection tools and analysis plans. After survey implementation, the survey report with the preliminary results must be submitted by the survey coordinator to the NITWG with a plausibility report attached. The NITWG then provides a final validation of the results after a thorough review of the data and final survey report. To be considered of good quality, the survey plausibility check report must show that data is of good quality, i.e., all criteria from the plausibility check report are within acceptable values,4 the sample size is above 80% of target children and the number of clusters included should be above 90% to ensure that the results are of high quality before being shared. This quality assurance process was previously completed by partner staff and consultants. To strengthen national capacity and ensure sustainability, this process is now conducted by officers from the MoH.
Management of a common repository
The absence of a data repository in the past made it difficult to access raw data from consultants and individual agencies and made it impossible to provide oversight on data quality. The NITWG agreed to have a common repository of raw datasets which include Emergency Nutrition Assessment files, questionnaires, methodologies and reports in both Word and PDF. After the NITWG has approved them, all survey reports are uploaded on a nutrition website managed by the government.5 The dissemination of findings through this website and survey dashboard allows access to information for any validated nutrition surveys in the country by all interested parties, allowing for real time programming and decision-making.
Achievements
Increased government funding to conduct SMART surveys
Following the actions described, the processes relating to SMART surveys are now clearer, resource mobilisation efforts are better coordinated and there is no more duplication. Stemming from an overall effort to increase capacity and ownership, the Government of Kenya has also significantly increased its financial investment in surveys over the years. County governments are now directly investing funds and leading on the mobilisation of funds for surveys as part of their annual plans. Table 1 reflects the investment made in surveys by the Government of Kenya in 2018 and 2019. While in some counties percentage contributions are still low, the actual financial commitment made has increased from previous years.
Table 1: Government SMART survey funding 2018/2019, in Kenyan Shillings (KSh)
| Timelines | County | Total cost (KSh) | Government contribution (KSh) | Government contribution (%) |
| July 2018 | Marsabit | 6,192,280 | 974,000 | 15.7% |
| July 2018 | Wajir | 4,200,660 | 1,796,800 | 42.8% |
| July 2019 | Garissa | 4,697,300 | 854,700 | 18% |
| June 2019 | Wajir | 2,729,433 | 1,513,100 | 55% |
| June 2019 | West Pokot | 2,585,550 | 190,550 | 7% |
| June 2019 | Turkana | 7,894,500 | 488,500 | 6% |
Government-led survey implementation
The streamlining of processes has resulted in increased capacity among government staff at both national and county level including better capacity for the coordination of resource mobilisation, joint planning, survey trainings and implementation. This has resulted in greater government ownership of survey management and results. Government staff at county level are also now leading surveys with minimal external support. This includes overall survey management, coordination, protocol development, presentation for validation, training, data collection, analysis, reporting and dissemination.
Timely preparedness and response
The availability of SMART survey data has allowed the early detection of a deteriorating situation in the country to prompt an early response. For example, in 2017, as a result of the nutrition analysis conducted in August 2016, the nutrition response action began even before the drought was officially declared. The Government of Kenya was therefore able to anticipate needs and allocated USD7,540,000 to the nutrition response.
Comparability over time and space
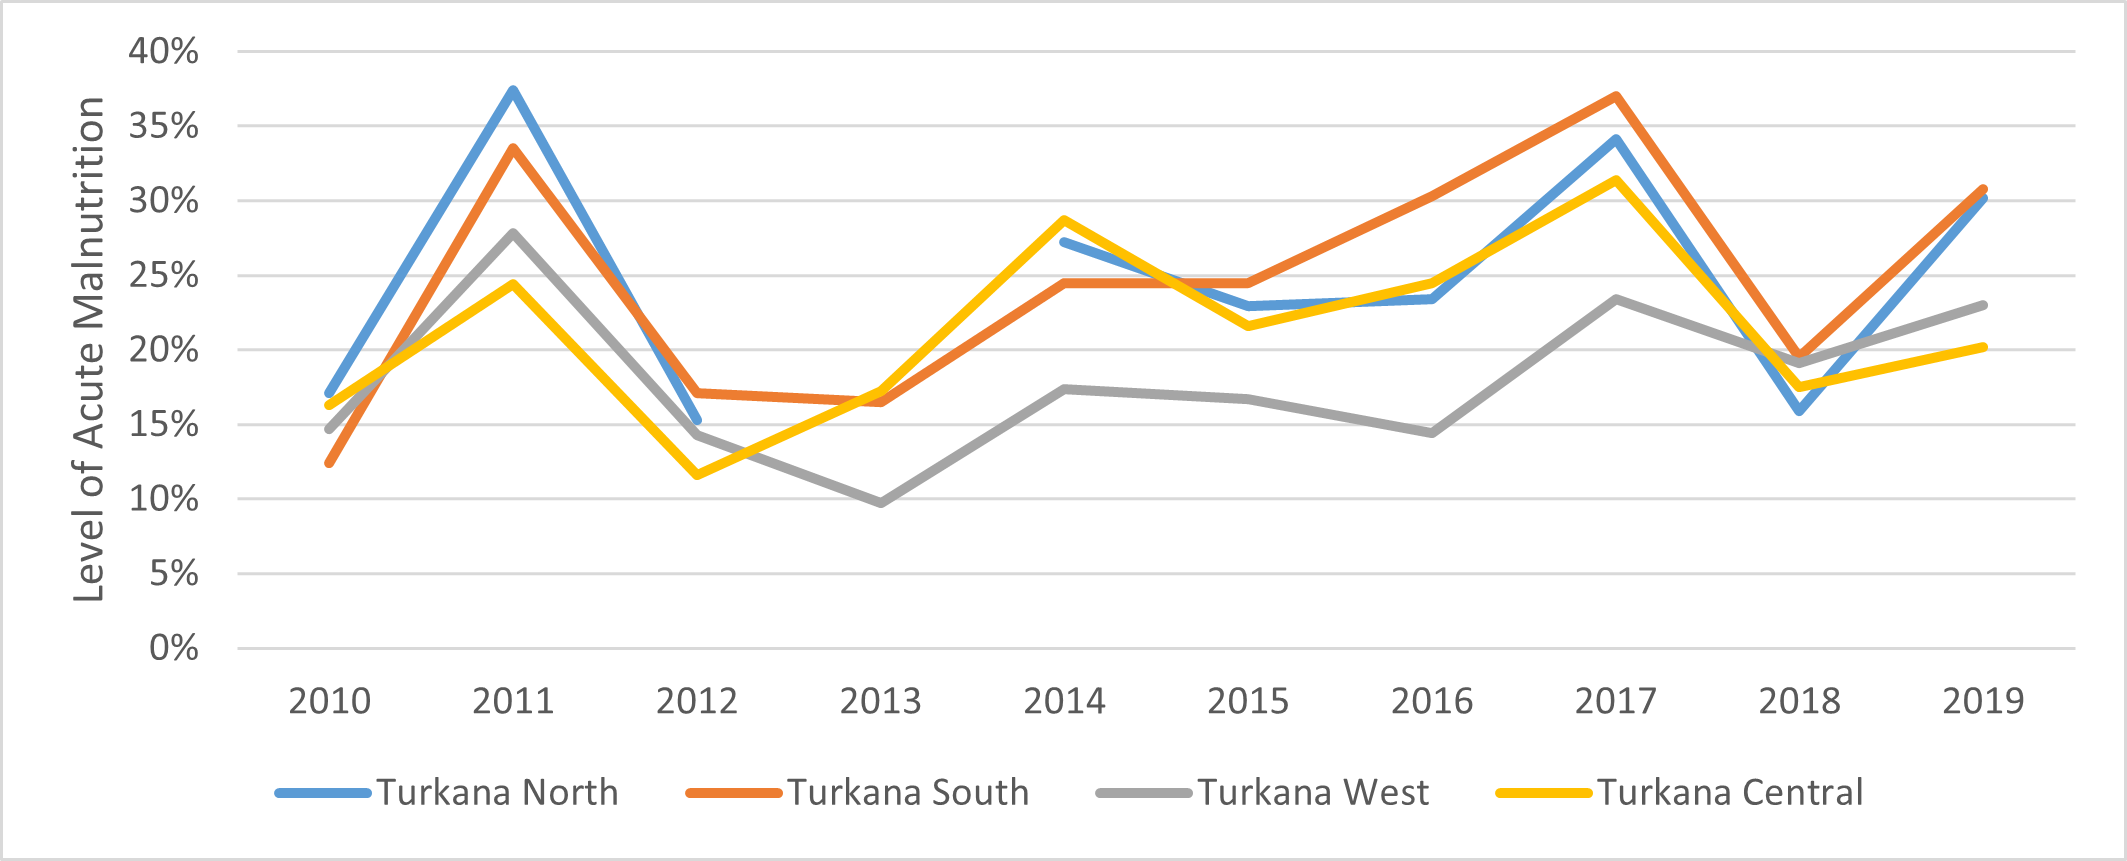
Because processes and field procedures are standardised, data generated over time is now comparable. SMART surveys for every survey zone are consistently conducted during a specific season, indicating when a situation is improving or deteriorating. As an example, Figure 3 illustrates the changes in acute malnutrition over time per survey zone in Turkana County where nutrition surveys are conducted annually towards the end of the long rains in the month of June. These survey results also feed into the ‘long rains assessments’ conducted biannually (in June and in February towards the end of the short rains). Persistently high global acute malnutrition / levels (exceeding the World Health Organization emergency threshold of 15%) in the past decade highlight no obvious recovery from the persistent shocks from drought, floods and conflict facing the community living in the county. Figure 3 also displays the similarity of the two episodes of drought that Kenya experienced in 2011 and 2017.
Figure 3: Trends in global acute malnutrition in Turkana county (SMART Surveys 2010-2019)
Quality data is available and used
Before surveys were coordinated and regulated, survey reports would be shared without an indication of data quality. Since estimating data quality is now a key requirement for any survey to be validated, the vast majority of surveys currently conducted in Kenya demonstrate the highest level of rigour, reliability and quality, therefore making Kenya a ‘centre of excellence’ on NIS. This has led to stronger collaborations beyond nutrition survey planning. For instance, the NITWG was engaged for the first time in the Kenya Demographic Health Survey in 2014 and provided support conducting the standardisation test, a technique from SMART methodology that consists of ensuring high data quality for anthropometric measurements.
To ensure that SMART survey results contribute comprehensively to situation analysis in Kenya (such as the integrated phase classification (IPC)), multiple sectors (food security, health and WASH) were consulted to identify key indicators to be systematically included in the standard nutrition surveys. SMART surveys are therefore now considered a reliable/valid source of data by other sectors and the nutrition sector is now perceived as the most coordinated sector from which up to date information is always available. This has raised the profile of the nutrition sector and provided a space for multi-sector engagement. The counties also use SMART survey data for baseline and planning information when developing County Integrated Development Plans6 and County Nutrition Work Plans.
Lessons learned
Investment in a government owned and sustained monitoring and evaluation framework for nutrition has formed the backbone of the now high-quality NIS infrastructure in Kenya, contributing to key result #16 of the Kenya Nutrition Action Plan. NIS standardised tools and methodologies have served to streamline capacity-building efforts and have allowed for comparability of results over time which was not previously possible.
Although high staff turnover has proved to be challenging, training government staff has enabled the NITWG to retain a pool of technical staff who are able to pass on knowledge to new entrants. The formation of task forces, including a SMART survey task force, has improved turnaround time, allowed deeper interrogation of methods, processes and procedures and has enabled targeted support where needed. Task forces also include members who have transitioned from NITWG and are now engaged as international experts on SMART surveys, many of whom remain engaged and able to provide technical support to the team when called upon via WhatsApp groups, by reviewing documents online and even volunteering to provide support during contract breaks.
A core mandate of the NITWG is to ensure succession planning and mentorship. The support, mentoring and coaching of new NITWG members/teams through the documentation and sharing of lessons learned have allowed new entrants to continue to build on what has gone on before. Over the years, the forum has remained vibrant and, as a result, this has ensured that a high level of expertise and capacity remain in the country.
Consistency is key. Since 2013, NITWG meetings have been held on the last Thursday of every month. This schedule has not changed despite many competing priorities such as the biannual IPC analysis that mostly happens towards the end of the month. The country has continued to hold virtual meetings consistently during this current COVID-19 pandemic period, making it easier for members to plan and block dates and for the planners to organise the meetings in advance. Teams that are planning to have surveys and protocols validated can easily fit into this schedule.
System wide capacity building is critical. Focusing on government staff capacity building helped to strengthen the ownership of processes while the standardisation of tools and methodologies enabled uniformity, data availability and quality. Leadership and ownership by government and the institutionalisation of processes has assured better results, ownership of the products and sustainable strategies. It is therefore important to continue efforts to maintain high quality data. This can be achieved through scheduled data clinics and coordinated survey implementation. It is also crucial to continue capacity support especially to government officials from counties that are not considered to be arid nor semi-arid areas. Engaging them during SMART training, survey implementation, data clinics, IPC analysis, NITWG meetings and any other NIS learning events are ways to keep them engaged and updated.
Kenya has multiple sources of information that complement each other. Besides SMART surveys, an early warning system is run by the National Drought and Management Authority and routine information is generated by the MoH. These sources provide data that can generate trend analysis over time to complement SMART survey results, ensuring no data gaps. Even during the COVID-19 pandemic when SMART surveys were halted, Kenya was still able to conduct IPC-acute malnutrition analysis due to the availability of these other sources of data.
Conclusions
Overall, the Kenya NIS has benefitted from having a clear monitoring and evaluation framework and well-defined coordination and quality control bodies. Key actions to improve SMART survey data quality included the streamlining of data collection methodologies, the capacity building of government and partner staff, the setting up of task forces, validating all survey methods and results and managing a common data repository. From our experience, the key ingredients for other countries to consider for a sustainable NIS include strengthening the capacity of government staff, succession planning and mentorship, coordinating efforts and resources and maintaining high standards and quality control frameworks. The COVID-19 pandemic affected NIS, just like all sectors, due to the cessation of all household surveys, including SMART surveys, for 2020. Availability of complementary data sources ensured continuity of information in the face of this unforeseen gap in the availability of survey data. This experience provides useful insights for other countries looking to enhance the use of SMART survey methodologies, and indeed other forms of nutrition surveillance, to contribute to a high quality, nationally owned NIS.
For more information, please contact Lydia Ndungu at lydianyambu123@gmail.com
1 https://smartmethodology.org
2 Additional indicators from other sectors such as food security, health and WASH were added to anthropometry and mortality core indicators
3 Now covered under key result #16 of the Kenya National Nutrition Plan 2018-2022
4 Those criteria are: % flagged data, sex ration, age distribution, digit preference for anthropometric measures, standard deviation of WHZ, shape of the distribution (skewness/kurtosis/index of dispersion)
6 A CIDP is a plan prepared by all counties to guide development over a five-year period.
More like this
FEX: Streamlining SMART survey processes to support the nutrition information system in Kenya
This is a summary of a Field Exchange field article that was included in issue 65. The original article was authored by Lydia Ndung'u, Lucy Maina-Gathigi, Lucy Kinyua, Hassan...
FEX: Improving nutrition information systems: lessons from Kenya
By Lucy Maina-Gathigi, Louise Mwirigi, Veronica Imelda, Dr Oleg Bilukha, Eva Leidman, Lucy Kinyua and Kibet Chirchir View this article as a pdf Lucy Maina-Gathigi is a...
FEX: South Sudan nutrition: Overcoming the challenges of nutrition information systems
The health sector in South Sudan, the youngest nation in Africa, has been growing from strength to strength amid insecurity and emergencies that have affected the general...
NEX: Decentralising data-driven decision-making in Kenya: Opportunities and challenges
View this article as a pdf Lisez cet article en français ici Edgar Okoth is the SUN Civil Society Alliance Coordinator in Kenya, hosted at Nutrition International, and...
FEX: Transitioning nutrition programming from humanitarian aid to health system strengthening in Kenya
View this article as a pdf Lisez cet article en français ici By Peter Hailey, Brenda Akwanyi, Emiliana Mbelenga and Tamsin Walters Peter Hailey is the Director of the...
FEX: Transitioning nutrition programming from humanitarian aid to health system strengthening in Kenya
This is a summary of a Field Exchange field article that was included in issue 64. The original article was authored by Peter Hailey, Brenda Akwanyi, Emiliana Mbelenga and...
FEX: Nutrition surveillance in emergency contexts: South Sudan case study
By Alina Michalska, Eva Leidman, Suzanne Fuhrman, Louise Mwirigi, Oleg Bilukha, and Cecile Basquin Alina Michalska is the SMART Programme Manager at Action Contre la Faim...
FEX: Implementation of nutrition surveys using SMART methodology in sub-Saharan Africa
By Jana Daher, Fanny Cassard, Sara Gari, Victoria Sauveplane-Stirling, Mara Nyawo and Patrick Codjia View this article as a pdf Lisez cet article en français ici Jana...
en-net: Save the Children seeks a Nutrition Survey Manager for South Sudan
ROLE PURPOSE: To provide overall leadership and management for nutrition survey; the role holder will be responsible for designing, planning, conducting, analysing and...
FEX: Implementing the IMAM Surge approach - experiences from Kenya
View this article as a pdf By Weldon Ngetich, Grace Gichohi, Francis Wambua, Tewoldeberhan Daniel, Yacob Yishak and Patrick Codjia Weldon Ngetich is a Nutrition Specialist...
FEX: Partnership and accountability in the South Sudan Nutrition Cluster (2015-2017)
By Isaack Biseko Manyama View this article as a pdf Lisez cet article en français ici Isaack Manyama is the Nutrition Cluster Coordinator for South Sudan. He has 24...
FEX: International Medical Corps strengthens nutrition alert and surveillance systems in South Sudan
View this article as a pdf Lisez cet article en français ici By Muhammad Ali Jatoi, Deepak Kumar, Dugsiye Ahmed and Iris Bollemeijer Muhammad Ali Jatoi is the Senior...
FEX: Stunting and wasting in children under two years old in a semi-nomadic pastoralist population in Kenya
By Amelia Reese-Masterson, Masumi Maehara and Mark Murage Gathii Amelia Reese-Masterson is Research Advisor in the Nutrition, Food Security and Livelihoods Unit at...
FEX: Undernutrition risk factors and their interplay with nutrition outcomes: nutrition causal analysis pilot in Kenya
By Kristy Manners, Muriel Calo, Imelda Awino and Jacob Korir Kristy Manners specialises in Nutrition and Public Health and has worked extensively in the horn of Africa. She is...
NEX: Nutrition advocacy in Kenya’s newly devolved government system
Titus Mung'ou was the Advocacy and Communications Manager at Action Against Hunger (ACF) at the time of writing. Jacob Korir is the Head of Health and Nutrition and Health...
en-net: SMART survey consultancy S Sudan (Unity State) with Concern Worldwide
Concern Worldwide, South Sudan TOR for a Consultant to conduct a SMART Nutrition Survey in Bentiu POC (Rubkona County) Unity State, South Sudan July 2015 Background Concern...
FEX: Transforming media coverage of nutrition in Kenya
By Titus Mung'ou Lisez cet article en français ici At the time of writing, Titus Mung'ou was the Advocacy and Communications Manager at Action Against Hunger (ACF) and...
FEX: Impact of community-based advocacy in Kenya
By Geoffrey Kipkosgei Tanui, Thatcher Ng'ong'a and Daniel Muhinja Geofrey Kipkosgei Tanui is currently working as a Community Development Officer for the Kenya Signature...
FEX: Scale up of high-impact nutrition interventions in the informal settlements of Nairobi, Kenya
View this article as a pdf Lisez cet article en français ici By Kassim Lupao and Esther Mogusu Kassim Lupao is a senior manager for the Nairobi urban health and...
NEX: Strengthening capacities for nutrition in Kenya: Developing a new framework
Fridah Mutea is director of Nutrition Programming with International Medical Corps (IMC), Kenya Mission. She holds a BSc in Food and Nutrition from the University of Eastern...
Reference this page
Lydia Ndung’u, Lucy Maina-Gathigi, Lucy Kinyua, Hassan Ali Ahmed, Kibet Chirchir and Samuel Mahinda Murage (). Streamlining SMART survey processes in support of a high quality, nationally owned nutrition information system in Kenya. Field Exchange 65, May 2021. p38. www.ennonline.net/fex/65/nutritioninformationsystemkenya
(ENN_7059)