
Using routine data for nutrition accountability: Experience from the Nigeria Governors’ Forum Nutrition Scorecard
Ahmad Abduwahab is the Senior Health Advisor of the Nigeria Governors’ Forum Secretariat.
Yashodhara Rana is an Associate Director at Results for Development.
Oluwagbenga Sadik is a Nutrition Policy Analyst with the Nigeria Governor’s Forum Secretariat.
Caroline Snead is a medical student at the Kaiser Permanente Bernard J. Tyson School of Medicine.
Grace Agi is a Nutritionist working with the Nigeria Governors’ Forum Secretariat.
Gianni Dongo is a Public Health Physician and Nigeria Governors’ Forum Programme Officer for Health.
Chinekwu Oreh is a Health Specialist with the Nigeria Governors’ Forum Secretariat
Rebecca Heidkamp is a Public Health Nutritionist and Associate Scientist at the Johns Hopkins Bloomberg School of Public Health who leads the DataDENT initiative.
The authors gratefully acknowledge the contributions of the Nigeria Health Management Information System team and UNICEF Nigeria office for the contents used in this manuscript and Albertha Nyaku and Alexandra Farina from Results for Development for their comments. We would also like to thank the Nigeria Federal Ministry of Budget and Planning, Alive and Thrive, UNICEF and CS-SUNN for their engagement in the development of the scorecard.
|
Location: Nigeria What is this article about: This article outlines the use of a nutrition scorecard in Nigeria that, in addition to enabling environmental indicators, includes nutrition outcome indicators drawn from HMIS/DHIS2 which is a critical source for routine nutrition data at the sub-national level. Key messages:
|
Background
Nigeria recently approved its National Multi-Sectoral Plan of Action for Food and Nutrition 2021-2025 which aims to reduce the rate of stunting among children under five years old from 31% to 18% and increase the rate of exclusive breastfeeding from 28% to 65% (Reliefweb, 2021). This ambitious agenda requires strong support from the Governors of Nigeria's 36 states.
The Nigeria Governors' Forum1 is a non-partisan platform that regroups all 36 Governors in the country. The platform uses data to inform the decision-making of Nigeria's Governors to promote good governance and development efforts. Scorecards have been used in the past to promote the Governors’ engagement on issues such as polio eradication and state-supported health insurance schemes.
In 2019, the Nigeria Governors’ Forum Secretariat decided to develop a similar tool for nutrition to track state-specific progress against the commitments made by the Governors to foster enabling environments for nutrition action. Those four commitments were:
- Set up or revitalise State Committees on Food and Nutrition
- Establish state-specific multi-sector plans of action on nutrition
- Increase budgetary spending on nutrition interventions
- Promote maternity protection for civil servants
Between 2019 and 2021, the Nigeria Governors’ Forum Secretariat collaborated with Data for Decisions to Expand Nutrition Transformation (DataDENT2), an initiative funded by the Bill & Melinda Gates Foundation that focuses on strengthening the global and national data value chain for nutrition. Other stakeholders were engaged including the Federal Ministry of Budget and National Planning, Alive and Thrive, Civil Society – Scaling Up Nutrition in Nigeria (CS-SUNN), Save the Children, and UNICEF to design and implement a nutrition scorecard (Rana et al, 2021).
The nutrition scorecard, shown in Figure 1, was launched in 2021 as an advocacy, accountability and monitoring tool to track state-specific progress against the four commitments made by the Governors. The scorecard is presented semi-annually to the Governors of each state.
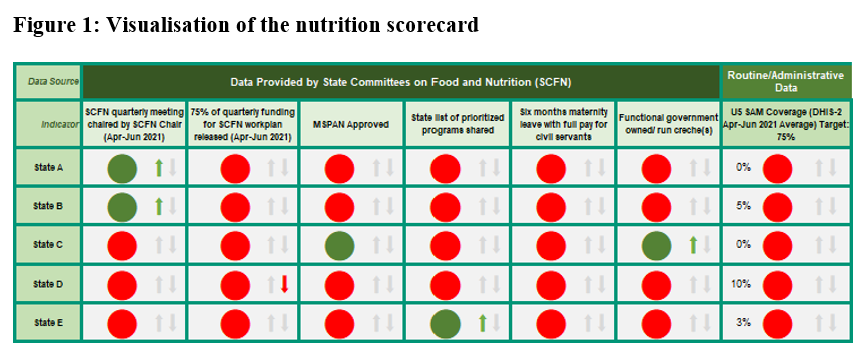
In addition to the indicators on the four commitments, the nutrition scorecard also includes an outcome indicator so that the Governors are sensitised to the overall nutrition situation in their respective states. Given that the nutrition scorecard is updated at the subnational level semi-annually, the outcome indicators are drawn from the health management information system (HMIS)/district health information software (DHIS2) reports. The challenges to using such administrative data are well-documented and include incomplete and inaccurate reporting, a shortage of data collection instruments, and limitations to estimating target populations for denominators (Agiraembabazi et al, 2021; Maina et al, 2017).
In this article, we describe the challenges encountered in the process of selecting nutrition outcome indicators for the Nigeria Governors’ Forum nutrition scorecard and highlight recommendations for improving the usability of the HMIS/DHIS2 data for similar purposes.
Process to select nutrition outcome indicators for the nutrition scorecard
The DHIS2 is a web-based software system that was adopted by Nigeria in 2010 to facilitate the collection and analysis of health data (Shuaib et al, 2020). Data is sourced from the national HMIS. All health facilities across the country complete a monthly summary form (NHMIS-001)3 using the data recorded in the facility-level HMIS registers. They then share these statistics up administrative levels via the DHIS2 web platform. Reporting rates, measured by the completeness of the NHMIS-001 form for all health facilities, are generally high: 76.2% in 2017, 80.6% in 2018, 86.2% in 2019 and 81.9% in 2020.
Figure 2: Nutrition-relevant data elements in the 2013 and 2019 health facility summary form (NHMIS-001)
|
2013 Indicators |
2019 Indicators |
|
# of children 0-59 months weighed – total |
# of children 0-59 months who received Nutrition/Growth Monitoring & Promotion Services** |
|
# of children 0-59 months weighing below the bottom line |
# of children 0-59 months who are growing well** |
|
# of children 0-6 months reporting being exclusively breastfed |
# of children 0-6 months receiving EBF |
|
# of children 6-11 months given vitamin A |
# of children 6-11 months given vitamin A |
|
# of children 12-59 months given vitamin A |
# of children 12-59 months given vitamin A |
|
# of children 12-59 months given deworming medication |
# of children 12-59 months who received deworming medications |
|
# of children <5 placed on treatment for severe acute malnutrition (OTP & SC)* |
# of children <5 admitted for treatment of SAM (new/transferred) |
|
# of children <5 discharged (as healthy) from treatment for severe acute malnutrition (recovered)* |
# of children <5 treated for SAM (treatment outcomes) recovered/defaulted/dead/transferred out** # of confirmed under-5 deaths due to malnutrition** |
|
# of children admitted into CMAM Program |
|
|
# of children defaulted from CMAM Program |
|
|
|
# of pregnant women counselled on maternal nutrition during ANC** |
|
|
# of pregnant women with severe anaemia** |
|
|
# of diabetes mellitus new cases** |
|
|
# of clients counselled on infant and young child nutrition (IYCN)** |
|
|
# of babies put to breast within 1 hour with skin-to-skin to keep warm** |
|
|
# of children 6-23 months given MNPs** |
|
|
# of diarrhoea new cases <5** |
**Indicator newly introduced in the 2019 version
Acronyms used stand for: OTP: outpatient therapeutic care, SC: stabilisation centre, CMAM: community-base management of acute malnutrition, EBF: exclusive breastfeeding, SAM: severe acute malnutrition, ANC: antenatal care, IYCN: Infant and young child nutrition, MNP: micronutrient powder.
The Nigeria Governors’ Forum and DataDENT teams worked together to select outcome indicators derived from DHIS2 data using a four-step process:
- First, the monthly summary form and the online DHIS2 dashboard were reviewed to identify available nutrition data elements. The 2013 version of the monthly summary format was updated in 2019 with several new or revised nutrition indicators (Figure 2). However, when the scorecard was designed, only six states – Benue, Delta, Imo, Kaduna, Nasarawa and Oyo – had rolled out the 2019 form. We therefore decided to only consider including indicators from the 2013 form into the nutrition scorecard.
- Next, for all the nutrition indicators available, the team downloaded monthly state-level data for the period January 2019 to November 2020. They reviewed the monthly trends, noting anomalies such as coverage indicators that had values greater than 100%.
- The team then narrowed down the list of potential indicators based on 1) the completeness of the data for the given indicator, and 2) whether the indicator reflected nutrition outcomes for all children and not only for those who had sought care at facilities. The team specifically assessed whether denominators could be constructed to reflect trends at the state level.
- Finally, the team confirmed with nutrition measurement experts and the HMIS/DHIS2 team in Nigeria that their proposed list of indicators was appropriate.
Indicators selected for inclusion in the nutrition scorecard
The team examined all the data elements available in the 2013 form as detailed in Table 1. After conducting that review, they settled on only one indicator – severe acute malnutrition (SAM) treatment coverage – because the data was generally complete for that indicator. The team also considered that this indicator could give an indication of the trends for all children. The calculation method, including how to determine both numerator and denominator, is provided in Box 1.
SAM treatment is almost exclusively delivered through health facilities, except in some emergency settings, so it was expected that the HMIS/DHIS2 system should capture most service delivery to populate the numerator. The denominator, calculated using census population projections and SAM prevalence from annual national surveys, estimates the number of all at-risk children. This indicator is calculated for each state and updated every quarter.
Box 1: SAM treatment coverage calculation method
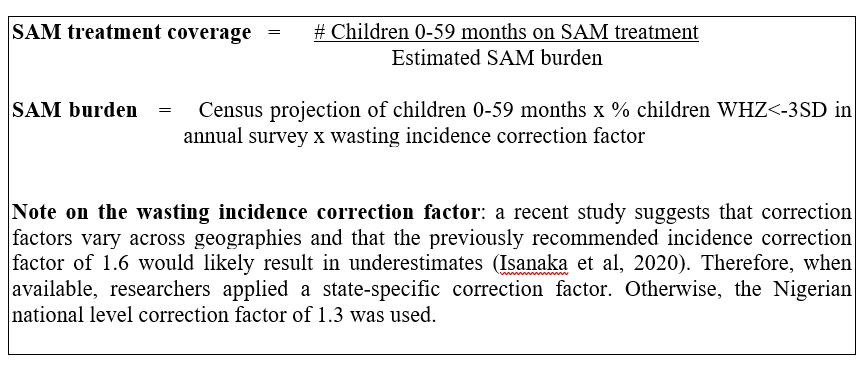
When defining the indicator’s calculation method, the authors considered using the denominator ‘Total Facility Attendance (0-59 months)’ from the 2013 form. However, this was not used as, while all children who attend a facility might be screened for wasting, only those identified as severely wasted should receive SAM treatment. Instead, the authors chose to estimate the total number of suspected SAM cases (0-59 months) in each state and at a given time by using the state population estimates for children 0-59 months and multiplying these by the state-level SAM prevalence estimates from the 2018 Demographic and Health Survey (DHS) and the wasting incidence correction factor (Box 1).
Estimating SAM treatment coverage directly – using methods such as the Simplified Lot Quality Assurance Sampling Evaluation of Access and Coverage (SLEAC) or the Simple Spatial Surveying Method (S3M) – would be more precise, although such methods were not employed due to infeasibility at scale. Therefore, estimating the denominator was deemed appropriate, although this may have resulted in an overestimation of burden.
Table 1: List of potential indicators considered for inclusion in the nutrition scorecard
|
Indicator |
Definition |
Numerator (and source of data) |
Denominator (and source of data) |
Observation |
|
SAM treatment coverage |
The proportion of severely malnourished children who can access care for SAM at the health facilities |
Children <5 years placed on treatment for SAM (HMIS/DHIS2 data) |
Census projection of children 0-59m multiplied by % children WHZ<-3SD in annual survey (DHS 2018) multiplied by wasting incidence correction factor |
This is the indicator included on the Nigeria Governors’ Forum scorecard.
|
|
Vitamin A coverage |
The proportion of children who receive age-appropriate doses of vitamin A in the last year |
Children (12-59 months) who received vitamin A (from HMIS/DHIS2) |
State population projections for children aged 12-59 months (from the 2006 census) multiplied by two (as there are two doses in a year) |
This data element does not specify whether the children counted received one, two or several doses of vitamin A. There is thus a very high risk of duplicate and inappropriate counts. Also, vitamin A is delivered through multiple platforms.
|
|
Exclusive breastfeeding rate |
The proportion of children who are exclusively breastfed in the first six months of life |
Children 0-6 months receiving exclusive breastfeeding (from HMIS/DHIS2) |
Facility attendance (0-1 years) – use the vaccine schedule to decide a percentage of visits to ascribe to 0-6 months |
The ideal denominator, ‘Facility attendance (0-6 months)’, is not available. |
|
Underweight |
The proportion of children who weighed below the bottom line in the last year |
Children (0-59 months) weighing below the bottom line (from HMIS/DHIS2) |
Children (0-59 months) weighed (from HMIS/DHIS2) |
Although all the data elements required to compute this indicator are available on HMIS/DHIS2, the indicator is no longer used by the nutrition community. |
|
Deworming |
The proportion of children 12-59 months who received deworming medication in the last year |
Children (12-59 months) who received deworming medication (from HMIS/DHIS2) |
Facility attendance (12-59 months) (from HMIS/DHIS2) multiplied by two (as there are two doses in a year) |
The majority of deworming tablets are distributed during campaigns and campaign data is not regularly captured in HMIS/DHIS2. |
|
SAM recovery |
The proportion of children who are successfully treated for SAM |
Children <5 years discharged healthy after nutritional treatment (from HMIS/DHIS2) |
Children <5 years discharged from the programme i.e., cured + non-recovered + defaulted + death (from HMIS/DHIS2) |
This indicator measures the outcomes of the SAM treatment programme but does not provide information on access to treatment. |
|
Growth monitoring |
The proportion of children whose growth is monitored at the health facilities |
Children (0-59 months) weighed (from HMIS/DHIS2) |
Facility attendance (0-59 months) (from HMIS/DHIS2) |
This measures a routine nutrition activity without a clear association with an outcome, hence the decision to exclude. |
Limitations of using routine data
Challenges in using administrative data, such as those found in HMIS/DHIS2 systems, are not unique to the nutrition sector or to Nigeria. To encourage further investments in HMIS/DHIS2 and overall data quality improvement, we reflected on some of the roadblocks encountered when using HMIS/DHIS2 indicators for the Nigeria Governors’ Forum nutrition scorecard.
Community-level nutrition services may not be adequately captured
Nigeria’s HMIS/DHIS2 system is not designed to capture community-level nutrition services. Several nutrition interventions in Nigeria are indeed commonly delivered through both facility and community-level platforms. For example, vitamin A supplementation and deworming can be given to children under five years of age in a health facility, but they are also frequently distributed through outreach campaigns, known as maternal, newborn, and child health (MNCH) weeks. The number of children reached with these services during these campaign activities is not consistently captured in the HMIS/DHIS2 systems; it may be reported through other channels. This means that, for example, to monitor the state-wide delivery of vitamin A and deworming, one cannot solely rely on a HMIS/DHIS2 indicator as the data would be misleading. For that reason, those indicators could not be considered for inclusion in the nutrition scorecard.
Age-disaggregated data to estimate denominators for some coverage indicators is not always available
The age-disaggregated data required to estimate denominators for some coverage indicators is not available in the HMIS/DHIS2 system. For example, in the case of the exclusive breastfeeding indicator that assesses the proportion of infants 0–5 months of age who are fed exclusively with breastmilk, the ideal denominator would be the total facility attendance of children aged 0-<6 months. However, the monthly facility reporting form only captures total facility attendance by newborns 0-28 days old and infants 0-1 years of age. There is no clear and reliable way to estimate the proportion of those who are under six months of age.
Data may have quality issues
Some indicators could not be used in the scorecard due to either too much missing data or the presence of anomalous results. For example, between July and September 2020, a state reported several months where the underweight prevalence spiked to up to 7700%. In 2020, we assumed missing data might have stemmed from the COVID-19 pandemic. There was, however, a high number of ‘0’ values for months in 2018 and 2019 which could not be explained.
Delay in the rollout of the 2019 monthly form and facility registers
As mentioned above, there were some delays in rolling out the 2019 monthly form and in updating facility registers. This meant that many potential nutrition indicators were not reported by most states. For example, only three out of 36 states had data for the indicator ‘Children <5 admitted for treatment of SAM (new/transferred)’. Among the states that had updated to the 2019 form, there were also many reporting months that had missing data. The Nigeria Governors’ Forum considered using projections to address the data gaps for some indicators in 2020 but this was not a viable option given the lack of historical data.
Recommendations
Given the challenges encountered, several recommendations were shared with the Federal Ministry of Health, which oversees the national HMIS. These recommendations may also be of relevance to those in other contexts who work with nutrition data from administrative systems such as the HMIS/DHIS2:
- Consider how outreach services can be reflected in HMIS/DHIS2 reports. Options might include: 1) creating an MNCH week event in HMIS/DHIS2, or 2) aggregating data on the monthly reporting forms of the health facility implementing the MNCH week.
- To estimate denominators, develop standardised catchment populations for age-specific nutrition services or consider establishing population-informed benchmarks for the absolute number of services delivered per month. For example, in Y state, we expect at least X total doses of vitamin A to be delivered per month.
- Consider including denominator estimates derived from other data sources in the HMIS/DHIS2 system. For instance, we were able to calculate the denominator for the SAM treatment coverage indicator with minimal effort given other data available in the system.
- Increase investment in facility-level data quality assessment and assurance activities – the focus should be around training on how to correctly extract and collate data from monthly forms and then enter the correct data into the HMIS/DHIS2 since it is difficult to edit post entry.
Conclusion
The HMIS/DHIS2 platform is a critical source for routine nutrition data in Nigeria, as in many countries. However, its utility for decision-making depends on improving the data quality, addressing information gaps and overcoming other shortcomings highlighted here. The Nigeria Governors’ Forum health team will continue to use data from the HMIS/DHIS2 platform for state-level advocacy and further engage stakeholders at the Federal Ministry of Health around the necessity to improve the quality and reliability of the data of the platform. We believe that data quality will improve when the data is actually used.
For more information, please contact Ahmad Abduwahab at aabdulwahab@ngf.org.ngf
For additional details, please read the following paper published through Gates Open Research in which the design team has outlined the process to develop the scorecard in greater depth: https://gatesopenresearch.org/articles/5-98
References
Agiraembabazi G, Ogwal J, Tashobya C, Kananura RM, Boerma T, Waiswa P (2021) Can routine health facility data be used to monitor subnational coverage of maternal, newborn and child health services in Uganda? BMC Health Services Research.
Isanaka S, Andersen C, Cousens S, Myatt M, Briend A, Krasevec J et al (2020) Improving estimates of the burden of severe wasting: analysis of secondary prevalence and incidence data from 352 sites. BMJ Global Health.
Maina I, Wanjala P, Soti D, Kipruto H, Droti B, Boerma T (2017) Using health-facility data to assess subnational coverage of maternal and child health indicators, Kenya. Bull World Health Organ,
Rana Y, Dongo G, Snead C, Agi G, Sadik O, Heidkamp R et al (2021) Developing effective data visualization tools for nutrition: Reflections on the design of a nutrition scorecard in Nigeria [version 1; peer review: 1 approved]. Gates Open Research.
Reliefweb (2021) National council on nutrition approves a five-year nutrition action plan for Nigeria. Reliefweb.int.
Shuaib F, Garba A, Meribole E, Obasi S, Sule A, Nnadi C et al (2020) Implementing the routine immunisation data module and dashboard of DHIS2 in Nigeria, 2014-2019. BMJ Global Health.
3 The NHSMIS Form 001 Health Facility Summary form is one of the several forms available on the DHIS2 platform with sections on Health Facility Attendance, Maternal Health, Pregnancy Outcomes, Immunisation and Nutrition.