
Background
Malnutrition is associated with about 50% of children’s deaths in poor countries. The best approach to reduce this mortality would be to improve the nutritional status and resilience of populations, particularly women and children, in order to eliminate malnutrition in the first place.
However, 45 million children are already wasted across the world according to the latest estimates (JME 2023). Wasting is one of the most life-threatening forms of malnutrition. As a child’s condition deteriorates and they become more severely wasted in the absence of appropriate care, this threat greatly increases. More severe forms of wasting require more intensive life-saving treatment due to the complicated effects on a child’s bodily systems and structures. 13.7 million children are estimated to be severely wasted and in need of urgent therapeutic treatment. These numbers are going up every year and official figures are widely understood to be an underestimate due to incident cases not being included.
Numbers or proportions of severely wasted children being reached with treatment globally are notoriously hard to find. This is due to different definitions (SAM (Severe Acute Malnutrition), severe wasting, severely low MUAC (mid-upper arm circumference)), lack of centralised reporting, no systematic assessment of coverage, and lack of transparent sharing. Watch our video on the limitations of estimates of the proportion of children who are being reached with treatment.
Even given these limitations, it is clear from any of the numbers quoted that – even for the most severely malnourished children – we have much further to go in reaching them with appropriate treatment.
With numbers of wasted children increasing every year and a context of diminishing resources due to global economic trends and drivers, it is increasingly important to target treatment to those who need it most. One way to focus our resources appropriately is to reserve the most intensive malnutrition treatment (most resource intensive for both service provider and client) for those most at risk of dying, and provide a less intensive treatment approach, and/or prevention approaches, for those with lower risk of death.
What was needed
Evidence collected by the WaSt TIG (Wasting and Stunting Technical Interest Group) (see list of members) suggests that being both wasted and stunted at the same time (even at moderate levels), i.e. being concurrently wasted and stunted, conveys additional risk. Children with both deficits are at particularly high risk of dying (similar to the risk of death for a severely wasted child). This indicates that we need to look at both wasting and stunting when we are trying to find the best ways to identify children at most risk of dying and in need of treatment.
We therefore wanted to review the ways we assess/identify malnourished children. Which of these measures and case definitions best select children at most risk of dying, without also identifying large numbers of children who are not at high risk? In practical terms, how can the case definitions we use help us to effectively reach those most at need without overburdening the health system?
Within nutrition programmes we mostly use anthropometric measures (as well as presence of oedema and medical complications) to identify types and levels of malnutrition in children and therefore construct our case definitions. For some things to bear in mind in relation to anthropometric indicators, what they can tell us, and what they cannot, watch our short video.
To assess the ability of different case definitions to predict death we needed to find studies tracking children over time and conducted before treatment was widely available or in contexts where it was not available. Once a child is being treated any study of mortality risk is biased by the effectiveness of the treatment being provided. Hence, we prioritised looking at studies where children were not treated in order to get an accurate picture of mortality risk even if that was at the expense of those studies being rather old.
What we did
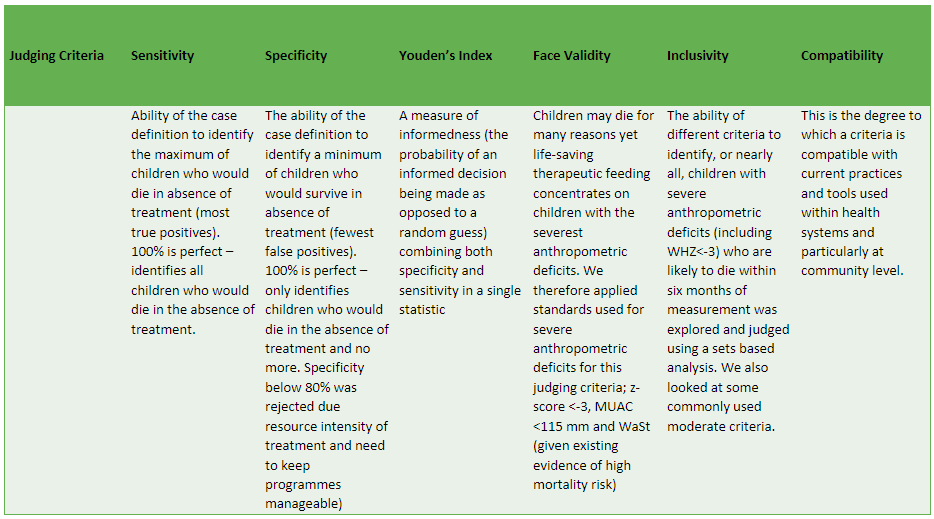
We sought out cohort studies tracking anthropometry and mortality conducted in low-income countries from times when treatment was not widespread and found 12 from 12 different countries. Evidence is clear that oedema does require the most intensive therapeutic treatment. Therefore, we focused our analyses on anthropometric indicators. We tested 12 different case definitions to see which were the best at predicting deaths in children aged 6–59 months. We had a number of judging criteria that we applied to these case definitions. See our annotated table of the judging criteria used with an explanation of each.
Table 1: Annotated table of the criteria used to judge different anthropometric case definitions.
We also looked at what the programmatic implications of our findings might be.
Most importantly, we were looking for case definitions that help us to identify for treatment the most children who would die in the absence of treatment (sensitivity) balanced with the minimum number of children who would survive in the absence of treatment (specificity).
Finding 1
From analysis presented as Receiver Operating Characteristic curves (a graphical way of illustrating the performance of different measures in identifying children who go on to die in the dataset – i.e. those at most risk) (please see this short video explanation of the results), we conclude that:
- MUAC and weight-for-age are the measures most associated with mortality risk
- Both measures may capture the effect of concurrent wasting and stunting on mortality risk
- Increasing cut-offs – looking at moderate definitions, for example, increases sensitivity (capturing more of the children that go on to die) but greatly increases false positives (capturing more of the children that don’t go on to die)
- Combining anthropometric indices can also increase sensitivity, but increases false positives too
- Increasing the frequency of follow-up – i.e. taking measures every month – greatly increases our ability to find those children at most risk of dying without including a large number of additional children who are not at high risk
Finding 2
From analysis of inclusivity using Venn diagrams (including four cohorts with MUAC measures within them) to see which measures captured most deaths within the data (below watch a four-minute video explaining the results of this analysis), we conclude that:
- By adding a severely low weight-for-age definition to severely low MUAC we capture the vast majority of deaths associated with all severe deficits. This includes deaths associated with being concurrently wasted and stunted and with severely low WHZ – i.e. we don’t need to measure these to capture deaths associated with them
- Similar results have been found by others in infants <6 months of age
- Increasing the MUAC cut-off to 125mm, without also using weight-for-age, is also promising in capturing most deaths but misses some high-risk children
Explaining how inclusively different anthropometric measures capture children who go on to die without treatment using coloured blocks:
Explaining how inclusively different anthropometric measures capture children who go on to die without treatment using coloured blocks:
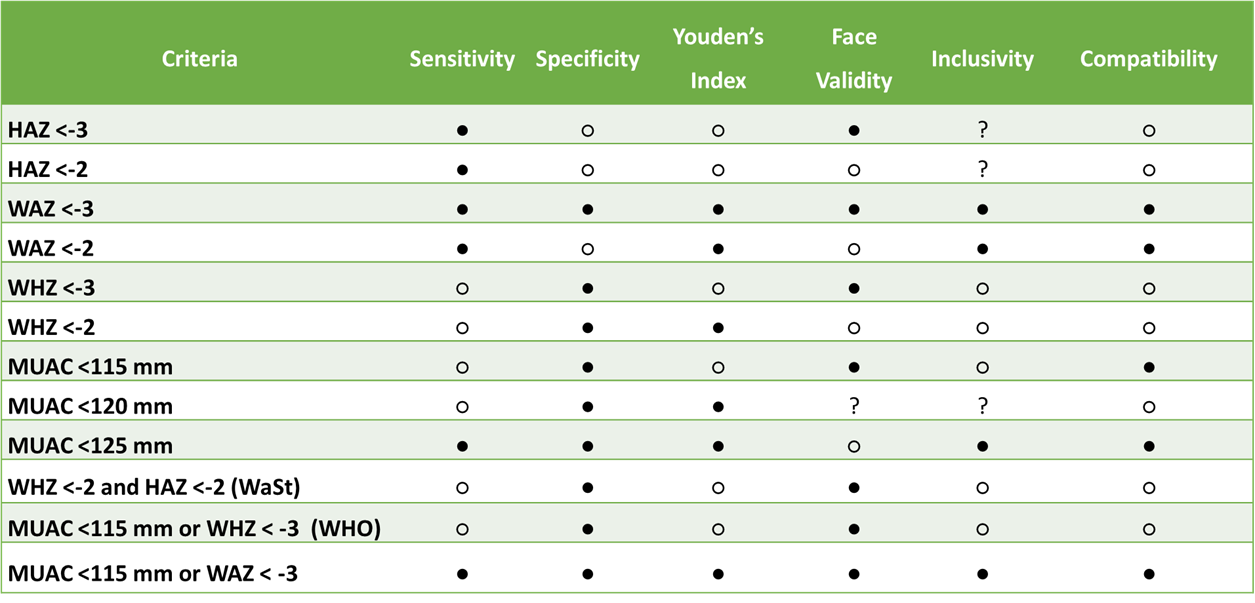
Summary of judging criteria
When we look at all judging criteria, we find that WAZ<-3 (weight-for-age z-score) alone and the combined definition of MUAC<115mm or WAZ<-3 performed best.
Finding 3
In order to further explore how treatment can be optimised we looked at risk of death for different components of the highest scoring case definitions, i.e. differing risk within the set of children identified. We hypothesised that in a cost-effective treatment model, those children at lower risk may be able to receive a less intensive (but still effective) form of treatment than standard outpatient therapeutic care. See the slide and recorded explanation of our findings below.
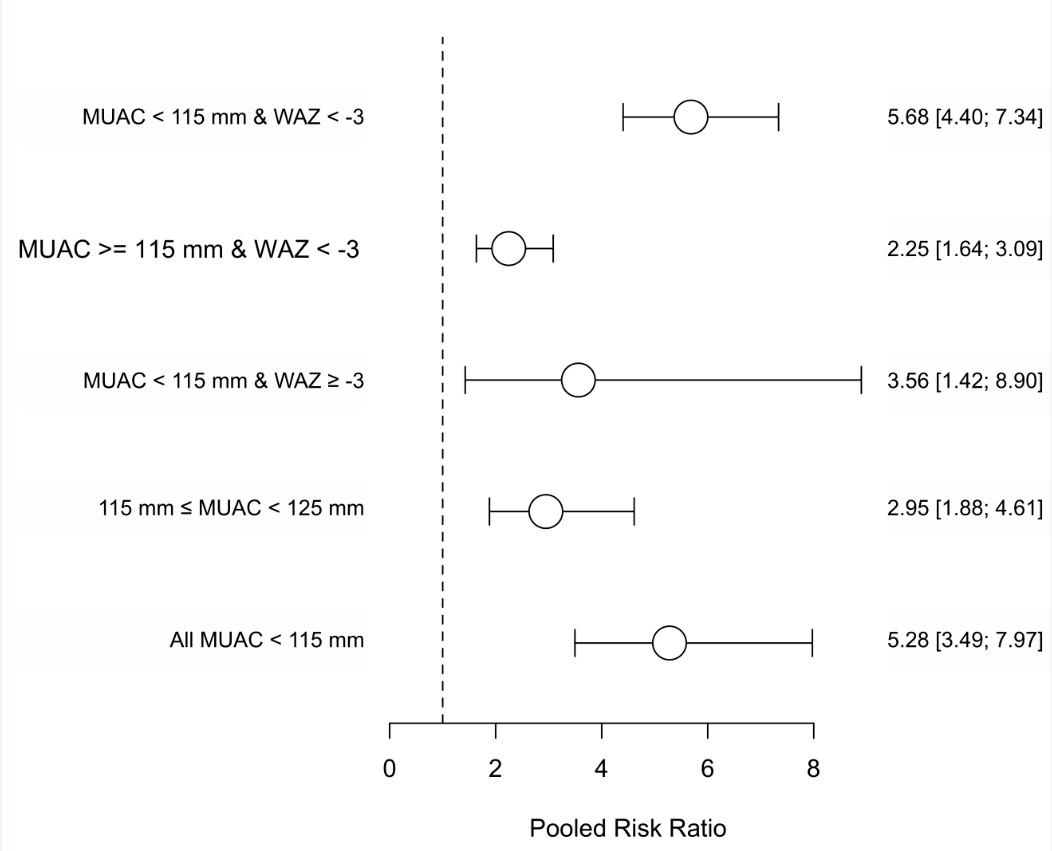
These results suggest that children with MUAC>115mm and WAZ<-3 could potentially require a less intensive treatment.
Modelling the implications
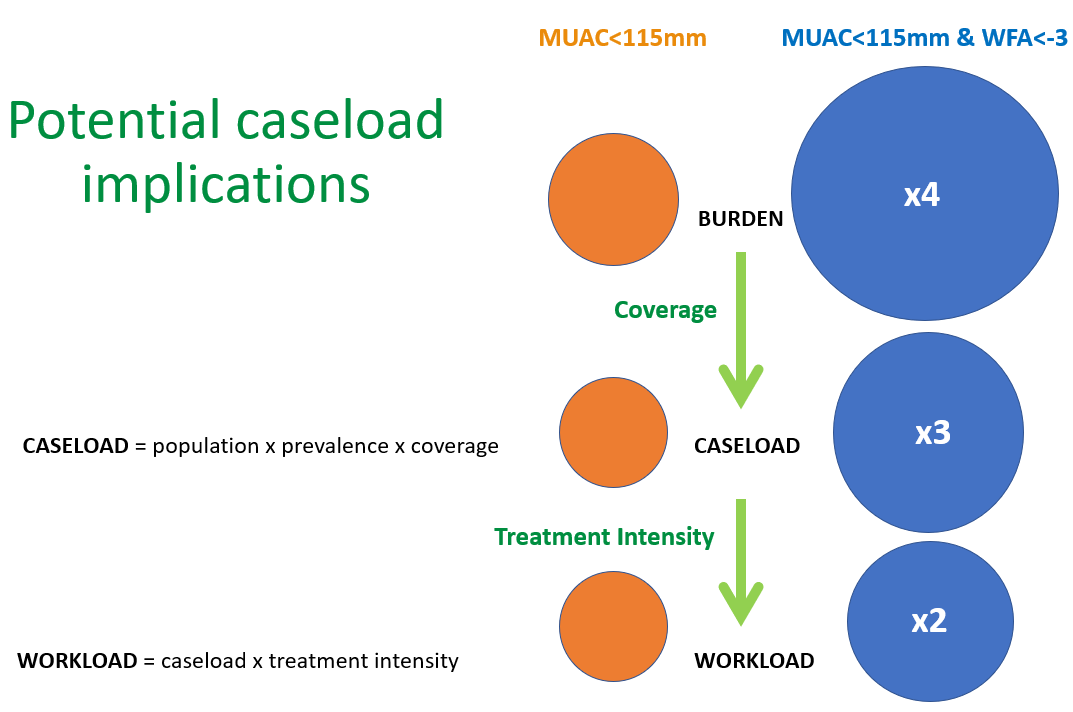
Given the above we wanted to make a rough estimate of what the operational/practical implications of adding WAZ<-3 as a criterion into treatment programmes would be in terms of programme size (compared to a programme admitting only on MUAC<115mm).
We simulated this for a hypothetical health district with a population of 100,000 people.
First, we took the burden of children with the case definitions (based on prevalence from a database of 2,426 nutrition surveys used in a previous analysis by Myatt et al (2018).
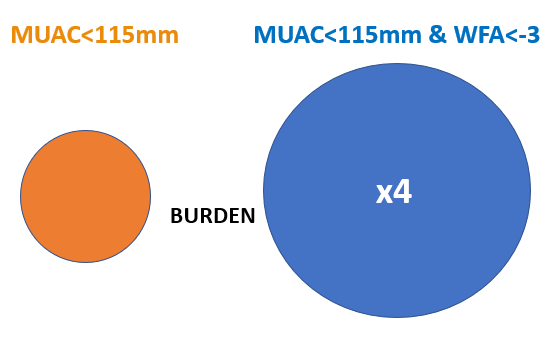
We then applied a coverage estimate to reach the potential caseload. For MUAC this was based on findings from 227 coverage assessments of CMAM programmes from 29 countries from 2009 to 2017, as recorded in a database provided by the Coverage Monitoring Network. For WAZ we conducted a literature review and applied estimates based on coverage data for 23 Growth Monitoring (and Promotion) programmes of differing scope and design from 14 countries.
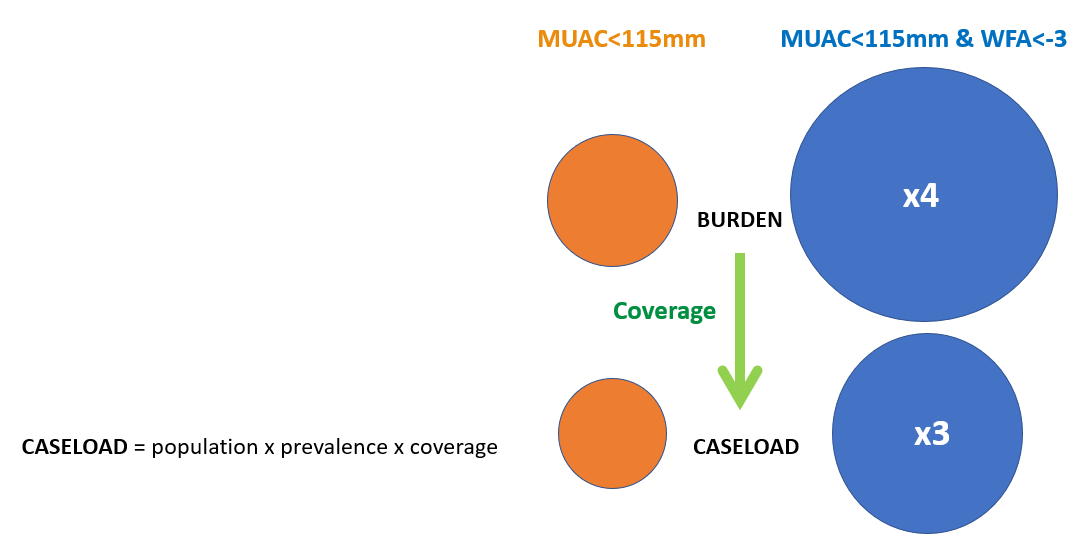
At this point, a programme admitting based on MUAC<115mm and WAZ<-3 was estimated to be three times the size of a MUAC-only programme. However, if we factor in a less intensive treatment for the additional children – i.e. look at workload rather than caseload – this comes down to two times the size.

What does this mean?
We conclude that examining mortality can help us to better design and align treatment services to reach the most at-risk children. Therapeutic feeding programmes may achieve higher impact (prevent mortality and improve coverage) by using measures that can be taken frequently at community level to identify children and by using a criterion of MUAC < 115 mm or WAZ < −3. The latter would have implications for programme size compared to a service treating children with severely low MUAC only. Our findings also suggest, however, that a less intensive treatment may well be suitable for the group of children with MUAC>115mm and WAZ<-3. This could make the additional caseload less time and resource intensive for the service provider. We need to answer outstanding questions around what ‘less intensive’ would mean in terms of how much therapeutic product, for how long, and how frequently. ENN and the WaSt TIG have designed an intervention study in order to do this and are keen to collaborate with others for its implementation.
The newly published WHO guideline on the prevention and management of wasting and nutritional oedema (acute malnutrition) in infants and children under five years also recommends the use of WAZ<-3 to identify high-risk, moderately wasted children for intervention with specially formulated food. This further underlines the need for intervention studies to determine how to operationalise this appropriately.
References
Khara T, Myatt M, Sadler K, et al. Anthropometric criteria for best-identifying children at high risk of mortality: a pooled analysis of twelve cohorts. Public Health Nutrition. 2023;26(4):803–819. doi:10.1017/S136898002300023X
Briend A, Myatt M, Berkley JA, et al. Prognostic value of different anthropometric indices over different measurement intervals to predict mortality in 6–59-month-old children. Public Health Nutr. 2023 Jun;26(6):1210–1221. doi: 10.1017/S1368980023000149
For more information on any of the above please see the WaSt area of our website, or to discuss potential collaboration please contact: Tanya Khara, ENN Technical Director, tanya@ennonline.net.
Acknowledgements
Huge thanks to André Briend and Hannah Fletcher for the creation of content and to the ENN WaSt team (Natalie Sessions, Phil James, Amir Samnani, and Kate Sadler) for review.
This blog and the work referred to in this blog was made possible by the generous support of the American people through the United States Agency for International Development and the Department of Foreign Affairs of Ireland. The contents are the responsibility of ENN and do not necessarily reflect the views of the donors.